विश्लेषण कमांड
computer-metrics कमांड
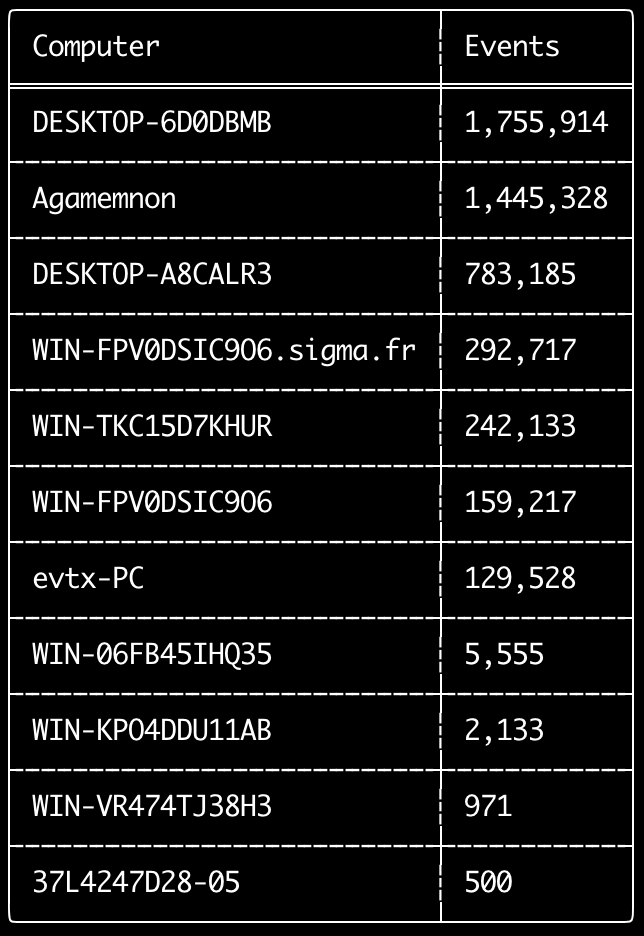
आप computer-metrics कमांड का उपयोग यह जांचने के लिए कर सकते हैं कि <System><Computer> फ़ील्ड में परिभाषित प्रत्येक कंप्यूटर के अनुसार कितने इवेंट हैं।
ध्यान रखें कि आप इवेंट्स को उनके मूल कंप्यूटर के अनुसार अलग करने के लिए Computer फ़ील्ड पर पूरी तरह भरोसा नहीं कर सकते।
Windows 11 कभी-कभी इवेंट लॉग में सहेजते समय पूरी तरह से अलग Computer नाम का उपयोग करेगा।
इसके अलावा, Windows 10 कभी-कभी Computer नाम को पूरी तरह से छोटे अक्षरों में रिकॉर्ड करेगा।
यह कमांड किसी भी डिटेक्शन नियम का उपयोग नहीं करता है इसलिए सभी इवेंट्स का विश्लेषण करेगा।
यह कमांड जल्दी से यह देखने के लिए एक अच्छा कमांड है कि किन कंप्यूटरों में सबसे अधिक लॉग हैं।
इस जानकारी के साथ, आप फिर अपनी टाइमलाइन बनाते समय --include-computer या --exclude-computer विकल्पों का उपयोग कर सकते हैं ताकि कंप्यूटर के अनुसार कई टाइमलाइन बनाकर या कुछ कंप्यूटरों के इवेंट्स को बाहर करके अपनी टाइमलाइन निर्माण को अधिक कुशल बना सकें।
Usage: computer-metrics <INPUT> [OPTIONS]

Input:
  -d, --directory <DIR>  Directory of multiple .evtx files
  -f, --file <FILE>      File path to one .evtx file
  -l, --live-analysis    Analyze the local C:\Windows\System32\winevt\Logs folder

General Options:
  -C, --clobber                        Overwrite files when saving
  -h, --help                           Show the help menu
  -J, --JSON-input                     Scan JSON formatted logs instead of .evtx (.json or .jsonl)
  -Q, --quiet-errors                   Quiet errors mode: do not save error logs
  -x, --recover-records                Carve evtx records from slack space (default: disabled)
  -c, --rules-config <DIR>             Specify custom rule config directory (default: ./rules/config)
      --target-file-ext <FILE-EXT...>  Specify additional evtx file extensions (ex: evtx_data)
  -t, --threads <NUMBER>               Number of threads (default: optimal number for performance)

Filtering:
      --time-offset <OFFSET>  Scan recent events based on an offset (ex: 1y, 3M, 30d, 24h, 30m)

Output:
  -o, --output <FILE>  Save the results in CSV format (ex: computer-metrics.csv)

Display Settings:
  -K, --no-color  Disable color output
  -q, --quiet     Quiet mode: do not display the launch banner
  -v, --verbose   Output verbose information
computer-metrics कमांड उदाहरण
- किसी डायरेक्टरी से कंप्यूटर नाम मेट्रिक्स प्रिंट करें:
hayabusa.exe computer-metrics -d ../logs - परिणामों को CSV फ़ाइल में सहेजें:
hayabusa.exe computer-metrics -d ../logs -o computer-metrics.csv
computer-metrics स्क्रीनशॉट
eid-metrics कमांड
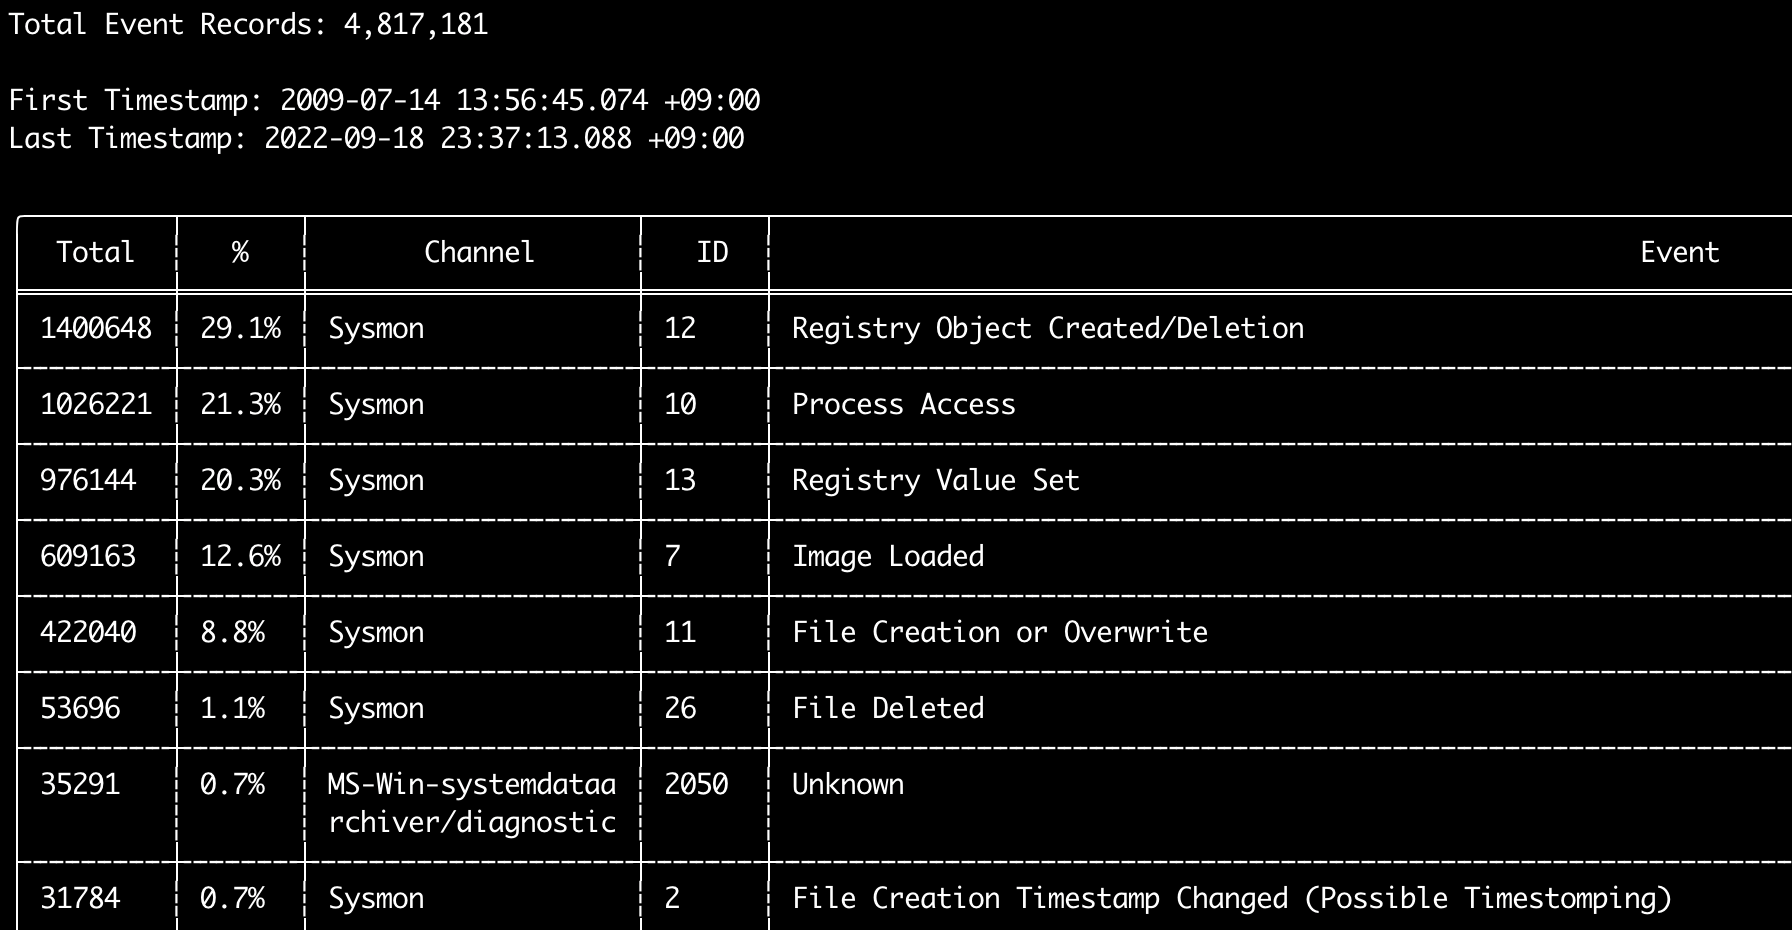
आप eid-metrics कमांड का उपयोग चैनलों द्वारा अलग किए गए इवेंट ID (<System><EventID> फ़ील्ड) की कुल संख्या और प्रतिशत प्रिंट करने के लिए कर सकते हैं।
यह कमांड किसी भी डिटेक्शन नियम का उपयोग नहीं करता है इसलिए सभी इवेंट्स को स्कैन करेगा।
Usage: eid-metrics <INPUT> [OPTIONS]

Input:
  -d, --directory <DIR>  Directory of multiple .evtx files
  -f, --file <FILE>      File path to one .evtx file
  -l, --live-analysis    Analyze the local C:\Windows\System32\winevt\Logs folder

General Options:
  -C, --clobber                        Overwrite files when saving
  -h, --help                           Show the help menu
  -J, --JSON-input                     Scan JSON formatted logs instead of .evtx (.json or .jsonl)
  -Q, --quiet-errors                   Quiet errors mode: do not save error logs
  -x, --recover-records                Carve evtx records from slack space (default: disabled)
  -c, --rules-config <DIR>             Specify custom rule config directory (default: ./rules/config)
  -t, --threads <NUMBER>               Number of threads (default: optimal number for performance)
      --target-file-ext <FILE-EXT...>  Specify additional evtx file extensions (ex: evtx_data)

Filtering:
      --exclude-computer <COMPUTER...>  Do not scan specified computer names (ex: ComputerA) (ex: ComputerA,ComputerB)
      --include-computer <COMPUTER...>  Scan only specified computer names (ex: ComputerA) (ex: ComputerA,ComputerB)
      --time-offset <OFFSET>            Scan recent events based on an offset (ex: 1y, 3M, 30d, 24h, 30m)

Output:
  -b, --disable-abbreviations  Disable abbreviations
  -o, --output <FILE>          Save the Metrics in CSV format (ex: metrics.csv)

Display Settings:
  -K, --no-color  Disable color output
  -q, --quiet     Quiet mode: do not display the launch banner
  -v, --verbose   Output verbose information

Time Format:
      --European-time     Output timestamp in European time format (ex: 22-02-2022 22:00:00.123 +02:00)
  -O, --ISO-8601          Output timestamp in original ISO-8601 format (ex: 2022-02-22T10:10:10.1234567Z) (Always UTC)
      --RFC-2822          Output timestamp in RFC 2822 format (ex: Fri, 22 Feb 2022 22:00:00 -0600)
      --RFC-3339          Output timestamp in RFC 3339 format (ex: 2022-02-22 22:00:00.123456-06:00)
      --US-military-time  Output timestamp in US military time format (ex: 02-22-2022 22:00:00.123 -06:00)
      --US-time           Output timestamp in US time format (ex: 02-22-2022 10:00:00.123 PM -06:00)
  -U, --UTC               Output time in UTC format (default: local time)
eid-metrics कमांड उदाहरण
- किसी एकल फ़ाइल से इवेंट ID मेट्रिक्स प्रिंट करें:
hayabusa.exe eid-metrics -f Security.evtx - किसी डायरेक्टरी से इवेंट ID मेट्रिक्स प्रिंट करें:
hayabusa.exe eid-metrics -d ../logs - परिणामों को CSV फ़ाइल में सहेजें:
hayabusa.exe eid-metrics -f Security.evtx -o eid-metrics.csv
eid-metrics कमांड कॉन्फ़िग फ़ाइल
इवेंट्स के चैनल, इवेंट ID और शीर्षक rules/config/channel_eid_info.txt में परिभाषित हैं।
उदाहरण:
Channel,EventID,EventTitle
Microsoft-Windows-Sysmon/Operational,1,Process Creation.
Microsoft-Windows-Sysmon/Operational,2,File Creation Timestamp Changed. (Possible Timestomping)
Microsoft-Windows-Sysmon/Operational,3,Network Connection.
Microsoft-Windows-Sysmon/Operational,4,Sysmon Service State Changed.
eid-metrics स्क्रीनशॉट
expand-list कमांड
नियम फ़ोल्डर से expand प्लेसहोल्डर निकालें।
यह कॉन्फ़िग फ़ाइलें बनाते समय किसी भी ऐसे नियम का उपयोग करने के लिए उपयोगी है जो expand फ़ील्ड मॉडिफायर का उपयोग करता है।
expand नियमों का उपयोग करने के लिए, आपको बस ./config/expand/ डायरेक्टरी के अंतर्गत expand फ़ील्ड मॉडिफायर के नाम के साथ एक .txt फ़ाइल बनानी होगी, और उन सभी मानों को फ़ाइल के अंदर डालना होगा जिन्हें आप जांचना चाहते हैं।
उदाहरण के लिए, यदि नियम का detection लॉजिक है:
detection:
    selection:
        EventID: 5145
        RelativeTargetName|contains: '\winreg'
    filter_main:
        IpAddress|expand: '%Admins_Workstations%'
    condition: selection and not filter_main
तो आप टेक्स्ट फ़ाइल ./config/expand/Admins_Workstations.txt बनाएंगे और उसमें इस तरह के मान डालेंगे:
यह मूल रूप से वही लॉजिक जांचेगा जैसे:
यदि कॉन्फ़िग फ़ाइल मौजूद नहीं है, तो Hayabusa फिर भी expand नियम को लोड करेगा लेकिन उसे अनदेखा करेगा।
Usage:  expand-list <INPUT> [OPTIONS]

General Options:
  -h, --help              Show the help menu
  -r, --rules <DIR/FILE>  Specify rule directory (default: ./rules)

Display Settings:
  -K, --no-color  Disable color output
  -q, --quiet     Quiet mode: do not display the launch banner
expand-list कमांड उदाहरण
- डिफ़ॉल्ट
rulesडायरेक्टरी सेexpandफ़ील्ड मॉडिफायर निकालें:hayabusa.exe expand-list sigmaडायरेक्टरी सेexpandफ़ील्ड मॉडिफायर निकालें:hayabusa.exe eid-metrics -r ../sigma
expand-list परिणाम
5 unique expand placeholders found:
Admins_Workstations
DC-MACHINE-NAME
Workstations
internal_domains
domain_controller_hostnames
extract-base64 कमांड
यह कमांड निम्नलिखित इवेंट्स से base64 स्ट्रिंग्स निकालेगा, उन्हें डिकोड करेगा और बताएगा कि किस प्रकार की एन्कोडिंग का उपयोग किया जा रहा है। * Security 4688 CommandLine * Sysmon 1 CommandLine, ParentCommandLine * System 7045 ImagePath * PowerShell Operational 4104 * PowerShell Operational 4103
Usage:  extract-base64 <INPUT> [OPTIONS]

Input:
  -d, --directory <DIR>  Directory of multiple .evtx files
  -f, --file <FILE>      File path to one .evtx file
  -l, --live-analysis    Analyze the local C:\Windows\System32\winevt\Logs folder

General Options:
  -C, --clobber                        Overwrite files when saving
  -h, --help                           Show the help menu
  -J, --JSON-input                     Scan JSON formatted logs instead of .evtx (.json or .jsonl)
  -Q, --quiet-errors                   Quiet errors mode: do not save error logs
  -x, --recover-records                Carve evtx records from slack space (default: disabled)
  -c, --rules-config <DIR>             Specify custom rule config directory (default: ./rules/config)
  -t, --threads <NUMBER>               Number of threads (default: optimal number for performance)
      --target-file-ext <FILE-EXT...>  Specify additional evtx file extensions (ex: evtx_data)

Filtering:
      --exclude-computer <COMPUTER...>  Do not scan specified computer names (ex: ComputerA) (ex: ComputerA,ComputerB)
      --include-computer <COMPUTER...>  Scan only specified computer names (ex: ComputerA) (ex: ComputerA,ComputerB)
      --time-offset <OFFSET>            Scan recent events based on an offset (ex: 1y, 3M, 30d, 24h, 30m)

Output:
  -o, --output <FILE>  Extract Base64 strings

Display Settings:
  -K, --no-color  Disable color output
  -q, --quiet     Quiet mode: do not display the launch banner
  -v, --verbose   Output verbose information

Time Format:
      --European-time     Output timestamp in European time format (ex: 22-02-2022 22:00:00.123 +02:00)
  -O, --ISO-8601          Output timestamp in original ISO-8601 format (ex: 2022-02-22T10:10:10.1234567Z) (Always UTC)
      --RFC-2822          Output timestamp in RFC 2822 format (ex: Fri, 22 Feb 2022 22:00:00 -0600)
      --RFC-3339          Output timestamp in RFC 3339 format (ex: 2022-02-22 22:00:00.123456-06:00)
      --US-military-time  Output timestamp in US military time format (ex: 02-22-2022 22:00:00.123 -06:00)
      --US-time           Output timestamp in US time format (ex: 02-22-2022 10:00:00.123 PM -06:00)
  -U, --UTC               Output time in UTC format (default: local time)
extract-base64 कमांड उदाहरण
- किसी डायरेक्टरी को स्कैन करें और टर्मिनल पर आउटपुट करें:
hayabusa.exe extract-base64 -d ../hayabusa-sample-evtx - किसी डायरेक्टरी को स्कैन करें और CSV फ़ाइल में आउटपुट करें:
hayabusa.exe eid-metrics -r ../sigma -o base64-extracted.csv
extract-base64 परिणाम
टर्मिनल पर आउटपुट करते समय, क्योंकि स्थान सीमित होता है, केवल निम्नलिखित फ़ील्ड प्रदर्शित होते हैं: * Timestamp * Computer * Base64 String * Decoded String (if not binary)
CSV फ़ाइल में सहेजते समय, निम्नलिखित फ़ील्ड सहेजे जाते हैं:
* Timestamp
* Computer
* Base64 String
* Decoded String (if not binary)
* Original Field
* Length
* Binary (Y/N)
* Double Encoding (when Y, it usually is malicious)
* Encoding Type
* File Type
* Event
* Record ID
* File Name
log-metrics कमांड
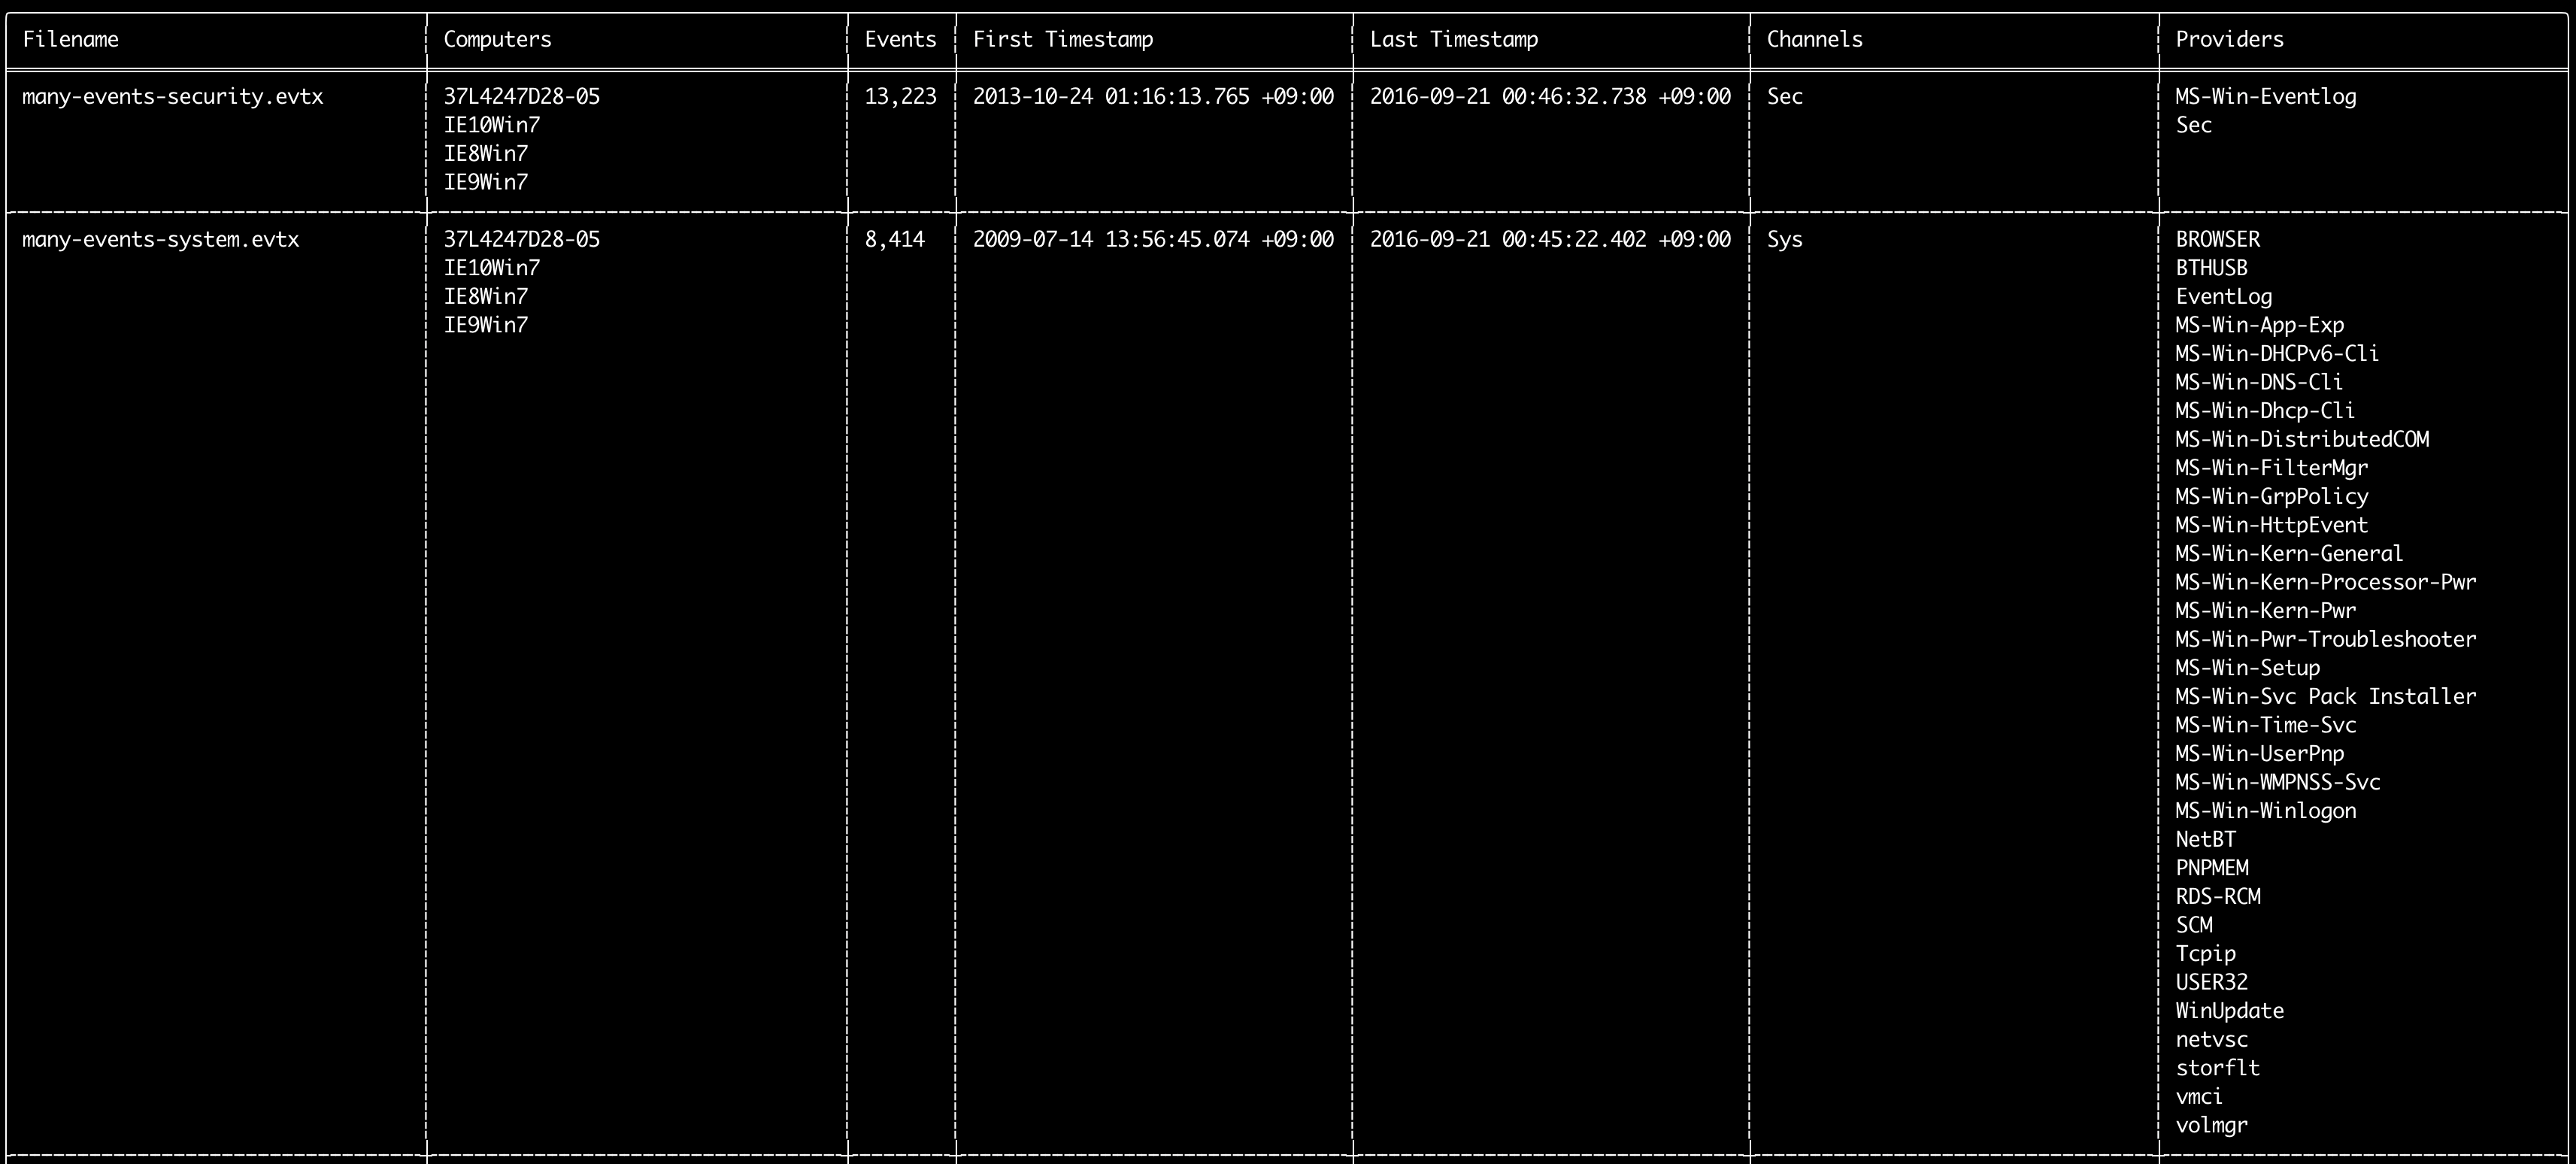
आप log-metrics कमांड का उपयोग इवेंट लॉग के अंदर निम्नलिखित मेटाडेटा प्रिंट करने के लिए कर सकते हैं:
* Filename
* Computer names
* Number of events
* First timestamp
* Last timestamp
* Channels
* Providers
यह कमांड किसी भी डिटेक्शन नियम का उपयोग नहीं करता है इसलिए सभी इवेंट्स को स्कैन करेगा।
Usage: log-metrics <INPUT> [OPTIONS]

Input:
  -d, --directory <DIR>  Directory of multiple .evtx files
  -f, --file <FILE>      File path to one .evtx file
  -l, --live-analysis    Analyze the local C:\Windows\System32\winevt\Logs folder

General Options:
  -C, --clobber                        Overwrite files when saving
  -h, --help                           Show the help menu
  -J, --JSON-input                     Scan JSON formatted logs instead of .evtx (.json or .jsonl)
  -Q, --quiet-errors                   Quiet errors mode: do not save error logs
  -x, --recover-records                Carve evtx records from slack space (default: disabled)
  -c, --rules-config <DIR>             Specify custom rule config directory (default: ./rules/config)
  -t, --threads <NUMBER>               Number of threads (default: optimal number for performance)
      --target-file-ext <FILE-EXT...>  Specify additional evtx file extensions (ex: evtx_data)

Filtering:
      --exclude-computer <COMPUTER...>  Do not scan specified computer names (ex: ComputerA) (ex: ComputerA,ComputerB)
      --include-computer <COMPUTER...>  Scan only specified computer names (ex: ComputerA) (ex: ComputerA,ComputerB)
      --time-offset <OFFSET>            Scan recent events based on an offset (ex: 1y, 3M, 30d, 24h, 30m)

Output:
  -b, --disable-abbreviations  Disable abbreviations
  -M, --multiline              Output event field information in multiple rows for CSV output
  -o, --output <FILE>          Save the Metrics in CSV format (ex: metrics.csv)
  -S, --tab-separator          Separate event field information by tabs

Display Settings:
  -K, --no-color  Disable color output
  -q, --quiet     Quiet mode: do not display the launch banner
  -v, --verbose   Output verbose information

Time Format:
      --European-time     Output timestamp in European time format (ex: 22-02-2022 22:00:00.123 +02:00)
  -O, --ISO-8601          Output timestamp in original ISO-8601 format (ex: 2022-02-22T10:10:10.1234567Z) (Always UTC)
      --RFC-2822          Output timestamp in RFC 2822 format (ex: Fri, 22 Feb 2022 22:00:00 -0600)
      --RFC-3339          Output timestamp in RFC 3339 format (ex: 2022-02-22 22:00:00.123456-06:00)
      --US-military-time  Output timestamp in US military time format (ex: 02-22-2022 22:00:00.123 -06:00)
      --US-time           Output timestamp in US time format (ex: 02-22-2022 10:00:00.123 PM -06:00)
  -U, --UTC               Output time in UTC format (default: local time)
log-metrics कमांड उदाहरण
- किसी एकल फ़ाइल से इवेंट ID मेट्रिक्स प्रिंट करें:
hayabusa.exe log-metrics -f Security.evtx - किसी डायरेक्टरी से इवेंट ID मेट्रिक्स प्रिंट करें:
hayabusa.exe log-metrics -d ../logs - परिणामों को CSV फ़ाइल में सहेजें:
hayabusa.exe log-metrics -d ../logs -o eid-metrics.csv
log-metrics स्क्रीनशॉट
logon-summary कमांड
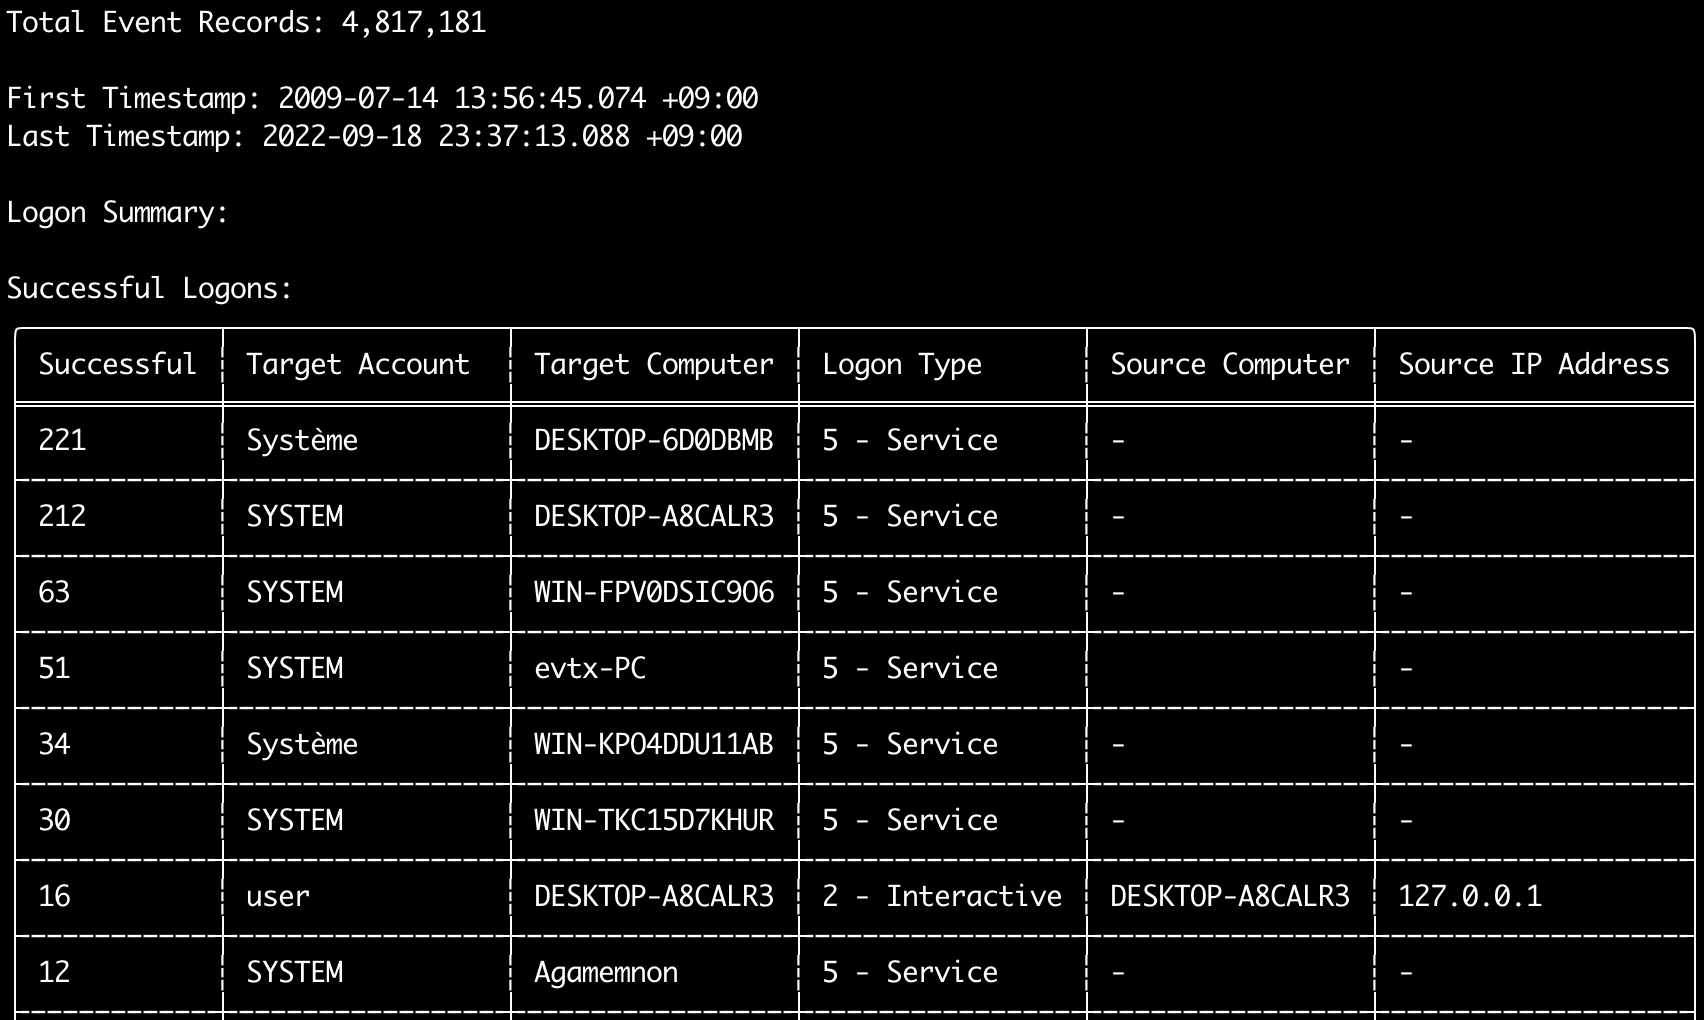
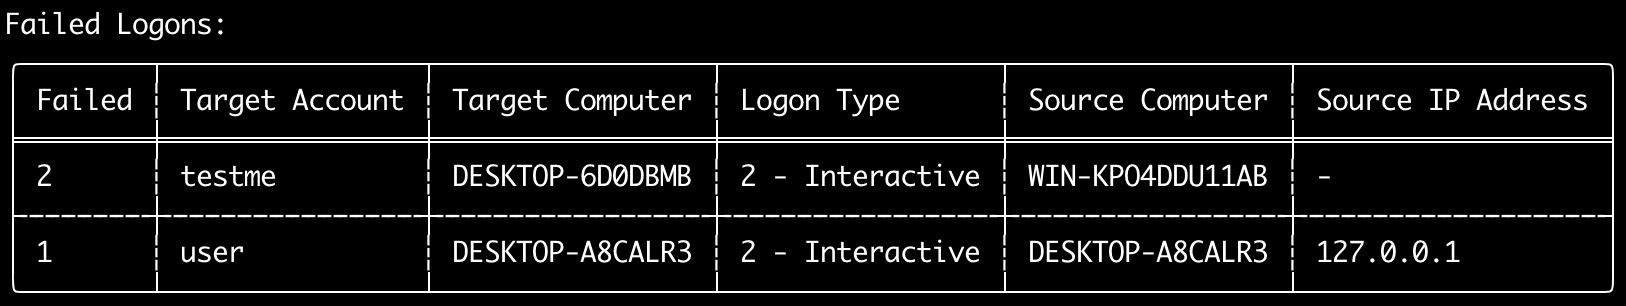
आप logon-summary कमांड का उपयोग लॉगऑन जानकारी सारांश (लॉगऑन उपयोगकर्ता नाम और सफल और असफल लॉगऑन गणना) आउटपुट करने के लिए कर सकते हैं।
आप एक evtx फ़ाइल के लिए -f के साथ या कई evtx फ़ाइलों के लिए -d विकल्प के साथ लॉगऑन जानकारी प्रदर्शित कर सकते हैं।
सफल लॉगऑन निम्नलिखित इवेंट्स से लिए जाते हैं:
* Security 4624 (Successful Logon)
* RDS-LSM 21 (Remote Desktop Service Local Session Manager Logon)
* RDS-GTW 302 (Remote Desktop Service Gateway Logon)
असफल लॉगऑन Security 4625 इवेंट्स से लिए जाते हैं।
Usage: logon-summary <INPUT> [OPTIONS]

Input:
  -d, --directory <DIR>  Directory of multiple .evtx files
  -f, --file <FILE>      File path to one .evtx file
  -l, --live-analysis    Analyze the local C:\Windows\System32\winevt\Logs folder

General Options:
  -C, --clobber                        Overwrite files when saving
  -h, --help                           Show the help menu
  -J, --JSON-input                     Scan JSON formatted logs instead of .evtx (.json or .jsonl)
  -Q, --quiet-errors                   Quiet errors mode: do not save error logs
  -x, --recover-records                Carve evtx records from slack space (default: disabled)
  -c, --rules-config <DIR>             Specify custom rule config directory (default: ./rules/config)
  -t, --threads <NUMBER>               Number of threads (default: optimal number for performance)
      --target-file-ext <FILE-EXT...>  Specify additional evtx file extensions (ex: evtx_data)

Filtering:
      --exclude-computer <COMPUTER...>  Do not scan specified computer names (ex: ComputerA) (ex: ComputerA,ComputerB)
      --include-computer <COMPUTER...>  Scan only specified computer names (ex: ComputerA) (ex: ComputerA,ComputerB)
      --time-offset <OFFSET>            Scan recent events based on an offset (ex: 1y, 3M, 30d, 24h, 30m)
      --timeline-end <DATE>             End time of the event logs to load (ex: "2022-02-22 23:59:59 +09:00")
      --timeline-start <DATE>           Start time of the event logs to load (ex: "2020-02-22 00:00:00 +09:00")

Output:
  -o, --output <FILENAME-PREFIX>  Save the logon summary to two CSV files (ex: -o logon-summary)

Display Settings:
  -K, --no-color  Disable color output
  -q, --quiet     Quiet mode: do not display the launch banner
  -v, --verbose   Output verbose information

Time Format:
      --European-time     Output timestamp in European time format (ex: 22-02-2022 22:00:00.123 +02:00)
  -O, --ISO-8601          Output timestamp in original ISO-8601 format (ex: 2022-02-22T10:10:10.1234567Z) (Always UTC)
      --RFC-2822          Output timestamp in RFC 2822 format (ex: Fri, 22 Feb 2022 22:00:00 -0600)
      --RFC-3339          Output timestamp in RFC 3339 format (ex: 2022-02-22 22:00:00.123456-06:00)
      --US-military-time  Output timestamp in US military time format (ex: 02-22-2022 22:00:00.123 -06:00)
      --US-time           Output timestamp in US time format (ex: 02-22-2022 10:00:00.123 PM -06:00)
  -U, --UTC               Output time in UTC format (default: local time)
logon-summary कमांड उदाहरण
- लॉगऑन सारांश प्रिंट करें:
hayabusa.exe logon-summary -f Security.evtx - लॉगऑन सारांश परिणाम सहेजें:
hayabusa.exe logon-summary -d ../logs -o logon-summary.csv
logon-summary स्क्रीनशॉट
pivot-keywords-list कमांड
आप pivot-keywords-list कमांड का उपयोग असामान्य उपयोगकर्ताओं, होस्टनामों, प्रक्रियाओं आदि की जल्दी से पहचान करने के साथ-साथ इवेंट्स को सहसंबंधित करने के लिए अद्वितीय पिवट कीवर्ड्स की एक सूची बनाने के लिए कर सकते हैं।
महत्वपूर्ण: डिफ़ॉल्ट रूप से, hayabusa सभी इवेंट्स (informational और उच्चतर) से परिणाम लौटाएगा इसलिए हम दृढ़ता से अनुशंसा करते हैं कि pivot-keywords-list कमांड को -m, --min-level विकल्प के साथ संयोजित करें।
उदाहरण के लिए, केवल critical अलर्ट से -m critical के साथ कीवर्ड बनाने से शुरू करें और फिर -m high, -m medium, आदि के साथ जारी रखें।
आपके परिणामों में संभवतः सामान्य कीवर्ड होंगे जो कई सामान्य इवेंट्स पर मेल खाएंगे, इसलिए परिणामों की मैन्युअल रूप से जांच करने और एक एकल फ़ाइल में अद्वितीय कीवर्ड्स की सूची बनाने के बाद, आप फिर grep -f keywords.txt timeline.csv जैसे कमांड के साथ संदिग्ध गतिविधि की एक संकीर्ण टाइमलाइन बना सकते हैं।
Usage: pivot-keywords-list <INPUT> [OPTIONS]

Input:
  -d, --directory <DIR>  Directory of multiple .evtx files
  -f, --file <FILE>      File path to one .evtx file
  -l, --live-analysis    Analyze the local C:\Windows\System32\winevt\Logs folder

General Options:
  -C, --clobber                        Overwrite files when saving
  -h, --help                           Show the help menu
  -J, --JSON-input                     Scan JSON formatted logs instead of .evtx (.json or .jsonl)
  -w, --no-wizard                      Do not ask questions. Scan for all events and alerts
  -Q, --quiet-errors                   Quiet errors mode: do not save error logs
  -x, --recover-records                Carve evtx records from slack space (default: disabled)
  -c, --rules-config <DIR>             Specify custom rule config directory (default: ./rules/config)
  -t, --threads <NUMBER>               Number of threads (default: optimal number for performance)
      --target-file-ext <FILE-EXT...>  Specify additional evtx file extensions (ex: evtx_data)

Filtering:
  -E, --EID-filter                      Scan only common EIDs for faster speed (./rules/config/target_event_IDs.txt)
  -D, --enable-deprecated-rules         Enable rules with a status of deprecated
  -n, --enable-noisy-rules              Enable rules set to noisy (./rules/config/noisy_rules.txt)
  -u, --enable-unsupported-rules        Enable rules with a status of unsupported
  -e, --exact-level <LEVEL>             Only load rules with a specific level (informational, low, medium, high, critical)
      --exclude-computer <COMPUTER...>  Do not scan specified computer names (ex: ComputerA) (ex: ComputerA,ComputerB)
      --exclude-eid <EID...>            Do not scan specific EIDs for faster speed (ex: 1) (ex: 1,4688)
      --exclude-status <STATUS...>      Do not load rules according to status (ex: experimental) (ex: stable,test)
      --exclude-tag <TAG...>            Do not load rules with specific tags (ex: sysmon)
      --include-computer <COMPUTER...>  Scan only specified computer names (ex: ComputerA) (ex: ComputerA,ComputerB)
      --include-eid <EID...>            Scan only specified EIDs for faster speed (ex: 1) (ex: 1,4688)
      --include-status <STATUS...>      Only load rules with specific status (ex: experimental) (ex: stable,test)
      --include-tag <TAG...>            Only load rules with specific tags (ex: attack.execution,attack.discovery)
  -m, --min-level <LEVEL>               Minimum level for rules to load (default: informational)
      --time-offset <OFFSET>            Scan recent events based on an offset (ex: 1y, 3M, 30d, 24h, 30m)
      --timeline-end <DATE>             End time of the event logs to load (ex: "2022-02-22 23:59:59 +09:00")
      --timeline-start <DATE>           Start time of the event logs to load (ex: "2020-02-22 00:00:00 +09:00")

Output:
  -o, --output <FILENAME-PREFIX>  Save pivot words to separate files (ex: PivotKeywords)

Display Settings:
  -K, --no-color  Disable color output
  -q, --quiet     Quiet mode: do not display the launch banner
  -v, --verbose   Output verbose information
pivot-keywords-list कमांड उदाहरण
- पिवट कीवर्ड्स को स्क्रीन पर आउटपुट करें:
hayabusa.exe pivot-keywords-list -d ../logs -m critical - critical अलर्ट से पिवट कीवर्ड्स की एक सूची बनाएं और परिणाम सहेजें। (परिणाम
keywords-Ip Addresses.txt,keywords-Users.txt, आदि में सहेजे जाएंगे):
pivot-keywords-list कॉन्फ़िग फ़ाइल
आप ./rules/config/pivot_keywords.txt को संपादित करके यह अनुकूलित कर सकते हैं कि आप किन कीवर्ड्स की खोज करना चाहते हैं।
यह पृष्ठ डिफ़ॉल्ट सेटिंग है।
प्रारूप KeywordName.FieldName है। उदाहरण के लिए, Users की सूची बनाते समय, hayabusa SubjectUserName, TargetUserName और User फ़ील्ड में सभी मानों को सूचीबद्ध करेगा।
search कमांड
search कमांड आपको सभी इवेंट्स पर कीवर्ड खोज करने देगा।
(केवल Hayabusa डिटेक्शन परिणाम ही नहीं।)
यह यह निर्धारित करने के लिए उपयोगी है कि क्या ऐसे इवेंट्स में कोई साक्ष्य है जो Hayabusa द्वारा पता नहीं लगाए जाते हैं।
Usage: hayabusa.exe search <INPUT> <--keywords "<KEYWORDS>" OR --regex "<REGEX>"> [OPTIONS]

Display Settings:
  -K, --no-color  Disable color output
  -q, --quiet     Quiet mode: do not display the launch banner
  -v, --verbose   Output verbose information

General Options:
  -C, --clobber                        Overwrite files when saving
  -h, --help                           Show the help menu
  -Q, --quiet-errors                   Quiet errors mode: do not save error logs
  -x, --recover-records                Carve evtx records from slack space (default: disabled)
  -c, --rules-config <DIR>             Specify custom rule config directory (default: ./rules/config)
  -t, --threads <NUMBER>               Number of threads (default: optimal number for performance)
      --target-file-ext <FILE-EXT...>  Specify additional evtx file extensions (ex: evtx_data)
  -s, --sort                           Sort results before saving the file (warning: this uses much more memory!)

Input:
  -d, --directory <DIR>  Directory of multiple .evtx files
  -f, --file <FILE>      File path to one .evtx file
  -l, --live-analysis    Analyze the local C:\Windows\System32\winevt\Logs folder

Filtering:
  -a, --and-logic              Search keywords with AND logic (default: OR)
  -F, --filter <FILTER...>     Filter by specific field(s)
  -i, --ignore-case            Case-insensitive keyword search
  -k, --keyword <KEYWORD...>   Search by keyword(s)
  -r, --regex <REGEX>          Search by regular expression
      --time-offset <OFFSET>   Scan recent events based on an offset (ex: 1y, 3M, 30d, 24h, 30m)
      --timeline-end <DATE>    End time of the event logs to load (ex: "2022-02-22 23:59:59 +09:00")
      --timeline-start <DATE>  Start time of the event logs to load (ex: "2020-02-22 00:00:00 +09:00")

Output:
  -b, --disable-abbreviations  Disable abbreviations
  -J, --JSON-output            Save the search results in JSON format (ex: -J -o results.json)
  -L, --JSONL-output           Save the search results in JSONL format (ex: -L -o results.jsonl)
  -M, --multiline              Output event field information in multiple rows for CSV output
  -o, --output <FILE>          Save the search results in CSV format (ex: search.csv)
  -S, --tab-separator          Separate event field information by tabs

Time Format:
      --European-time     Output timestamp in European time format (ex: 22-02-2022 22:00:00.123 +02:00)
  -O, --ISO-8601          Output timestamp in original ISO-8601 format (ex: 2022-02-22T10:10:10.1234567Z) (Always UTC)
      --RFC-2822          Output timestamp in RFC 2822 format (ex: Fri, 22 Feb 2022 22:00:00 -0600)
      --RFC-3339          Output timestamp in RFC 3339 format (ex: 2022-02-22 22:00:00.123456-06:00)
      --US-military-time  Output timestamp in US military time format (ex: 02-22-2022 22:00:00.123 -06:00)
      --US-time           Output timestamp in US time format (ex: 02-22-2022 10:00:00.123 PM -06:00)
  -U, --UTC               Output time in UTC format (default: local time)
search कमांड उदाहरण
../hayabusa-sample-evtxडायरेक्टरी में कीवर्डmimikatzखोजें:
नोट: यदि
mimikatzडेटा में कहीं भी पाया जाता है तो कीवर्ड मेल खाएगा। यह एक सटीक मेल नहीं है।
../hayabusa-sample-evtxडायरेक्टरी में कीवर्डmimikatzयाkaliखोजें:
../hayabusa-sample-evtxडायरेक्टरी में कीवर्डmimikatzखोजें और केस को अनदेखा करें:
- नियमित अभिव्यक्तियों का उपयोग करके
../hayabusa-sample-evtxडायरेक्टरी में IP पते खोजें:
../hayabusa-sample-evtxडायरेक्टरी खोजें और वे सभी इवेंट्स दिखाएं जहांWorkstationNameफ़ील्डkaliहै:
नोट:
.*प्रत्येक इवेंट पर मेल खाने के लिए नियमित अभिव्यक्ति है।
search कमांड कॉन्फ़िग फ़ाइलें
./rules/config/channel_abbreviations.txt: चैनल नामों और उनके संक्षिप्त रूपों की मैपिंग।