Comandos de análisis
Comando computer-metrics
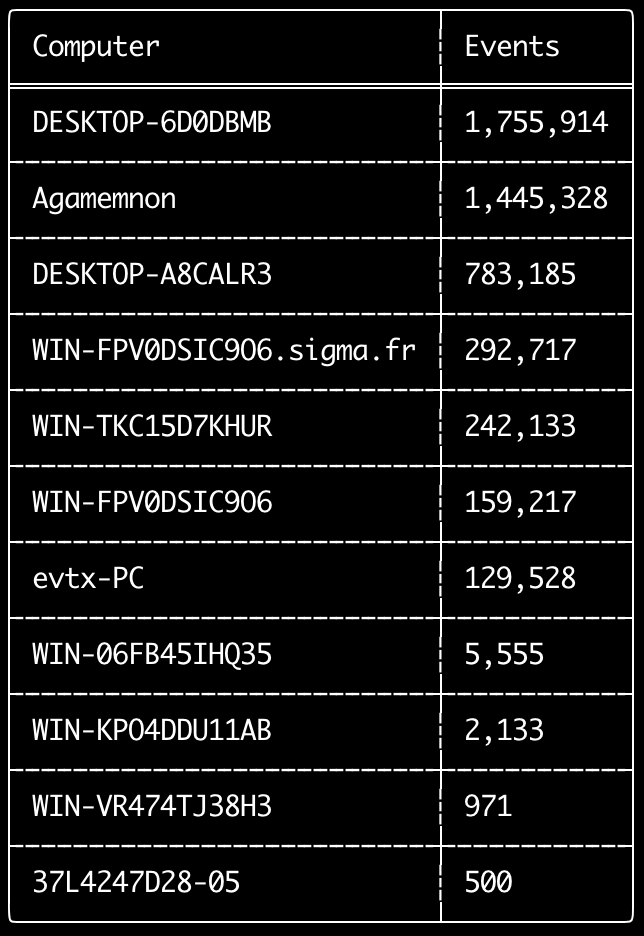
Puede usar el comando computer-metrics para comprobar cuántos eventos hay según cada equipo definido en el campo <System><Computer>.
Tenga en cuenta que no puede confiar completamente en el campo Computer para separar eventos por su equipo de origen.
Windows 11 a veces usará nombres de Computer completamente diferentes al guardar en los registros de eventos.
Además, Windows 10 a veces registrará el nombre de Computer todo en minúsculas.
Este comando no usa ninguna regla de detección, por lo que analizará todos los eventos.
Este es un buen comando para ejecutar y ver rápidamente qué equipos tienen más registros.
Con esta información, puede usar las opciones --include-computer o --exclude-computer al crear sus líneas de tiempo para hacer que la generación de su línea de tiempo sea más eficiente creando varias líneas de tiempo según el equipo o excluyendo eventos de ciertos equipos.
Usage: computer-metrics <INPUT> [OPTIONS]

Input:
  -d, --directory <DIR>  Directory of multiple .evtx files
  -f, --file <FILE>      File path to one .evtx file
  -l, --live-analysis    Analyze the local C:\Windows\System32\winevt\Logs folder

General Options:
  -C, --clobber                        Overwrite files when saving
  -h, --help                           Show the help menu
  -J, --JSON-input                     Scan JSON formatted logs instead of .evtx (.json or .jsonl)
  -Q, --quiet-errors                   Quiet errors mode: do not save error logs
  -x, --recover-records                Carve evtx records from slack space (default: disabled)
  -c, --rules-config <DIR>             Specify custom rule config directory (default: ./rules/config)
      --target-file-ext <FILE-EXT...>  Specify additional evtx file extensions (ex: evtx_data)
  -t, --threads <NUMBER>               Number of threads (default: optimal number for performance)

Filtering:
      --time-offset <OFFSET>  Scan recent events based on an offset (ex: 1y, 3M, 30d, 24h, 30m)

Output:
  -o, --output <FILE>  Save the results in CSV format (ex: computer-metrics.csv)

Display Settings:
  -K, --no-color  Disable color output
  -q, --quiet     Quiet mode: do not display the launch banner
  -v, --verbose   Output verbose information
Ejemplos del comando computer-metrics
- Imprimir métricas de nombres de equipos desde un directorio:
hayabusa.exe computer-metrics -d ../logs - Guardar los resultados en un archivo CSV:
hayabusa.exe computer-metrics -d ../logs -o computer-metrics.csv
Captura de pantalla de computer-metrics
Comando eid-metrics
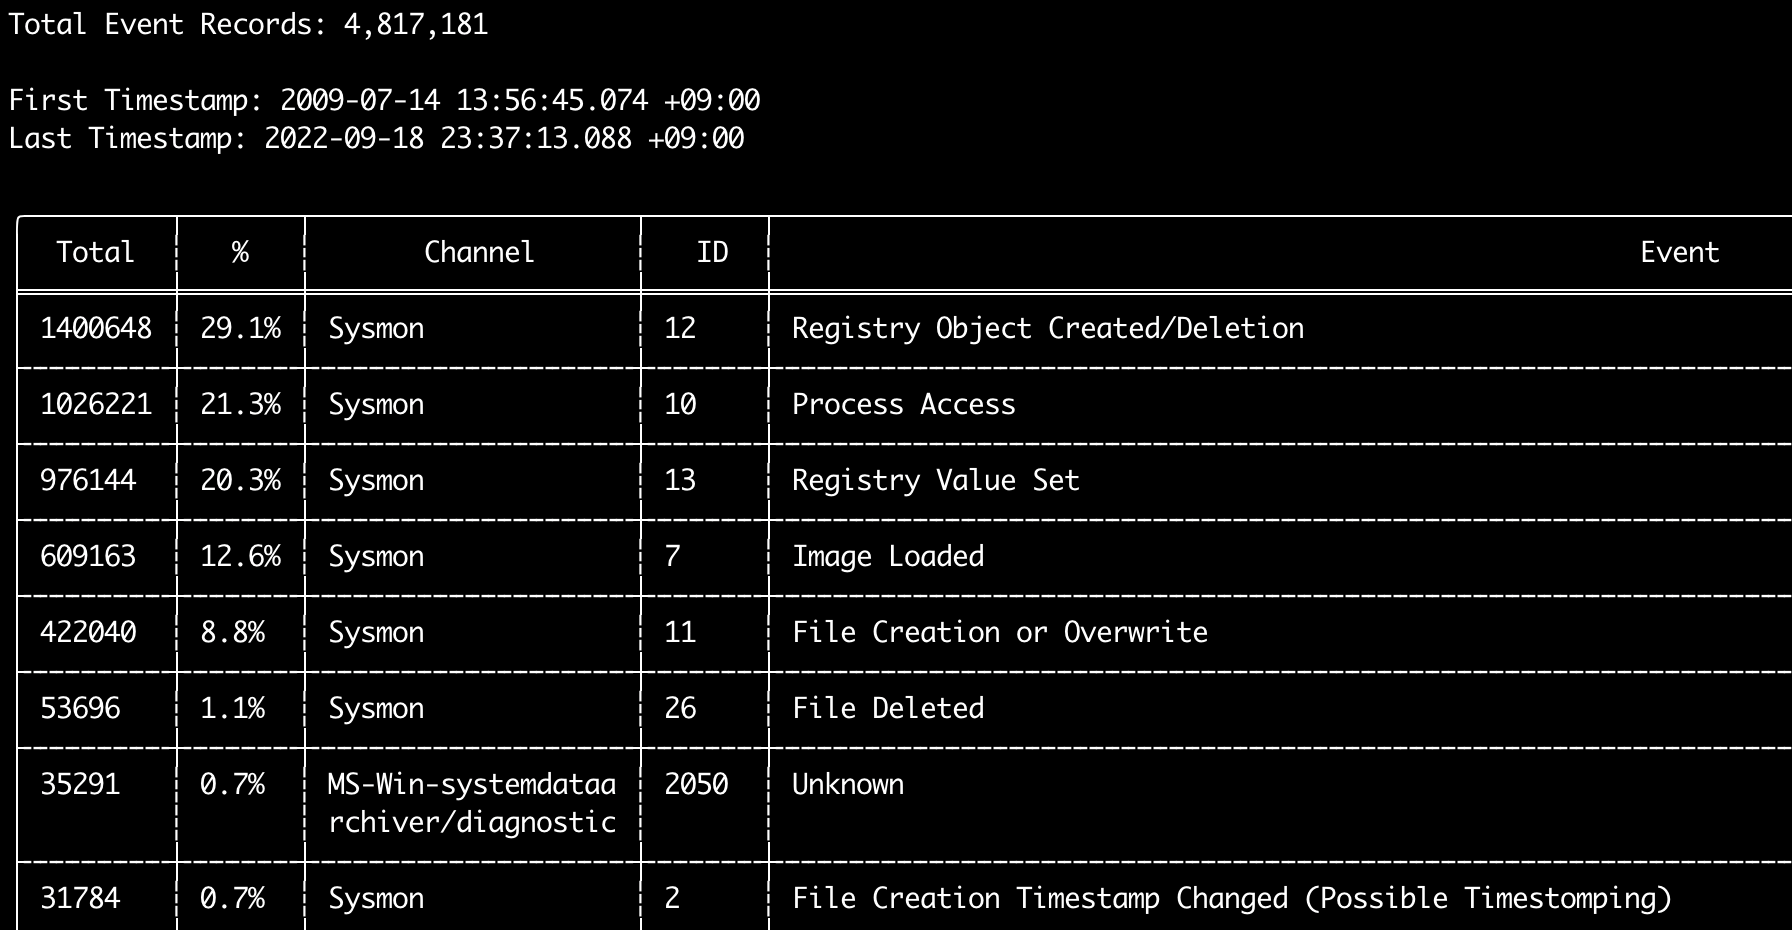
Puede usar el comando eid-metrics para imprimir el número total y el porcentaje de los IDs de evento (campo <System><EventID>) separados por canales.
Este comando no usa ninguna regla de detección, por lo que escaneará todos los eventos.
Usage: eid-metrics <INPUT> [OPTIONS]

Input:
  -d, --directory <DIR>  Directory of multiple .evtx files
  -f, --file <FILE>      File path to one .evtx file
  -l, --live-analysis    Analyze the local C:\Windows\System32\winevt\Logs folder

General Options:
  -C, --clobber                        Overwrite files when saving
  -h, --help                           Show the help menu
  -J, --JSON-input                     Scan JSON formatted logs instead of .evtx (.json or .jsonl)
  -Q, --quiet-errors                   Quiet errors mode: do not save error logs
  -x, --recover-records                Carve evtx records from slack space (default: disabled)
  -c, --rules-config <DIR>             Specify custom rule config directory (default: ./rules/config)
  -t, --threads <NUMBER>               Number of threads (default: optimal number for performance)
      --target-file-ext <FILE-EXT...>  Specify additional evtx file extensions (ex: evtx_data)

Filtering:
      --exclude-computer <COMPUTER...>  Do not scan specified computer names (ex: ComputerA) (ex: ComputerA,ComputerB)
      --include-computer <COMPUTER...>  Scan only specified computer names (ex: ComputerA) (ex: ComputerA,ComputerB)
      --time-offset <OFFSET>            Scan recent events based on an offset (ex: 1y, 3M, 30d, 24h, 30m)

Output:
  -b, --disable-abbreviations  Disable abbreviations
  -o, --output <FILE>          Save the Metrics in CSV format (ex: metrics.csv)

Display Settings:
  -K, --no-color  Disable color output
  -q, --quiet     Quiet mode: do not display the launch banner
  -v, --verbose   Output verbose information

Time Format:
      --European-time     Output timestamp in European time format (ex: 22-02-2022 22:00:00.123 +02:00)
  -O, --ISO-8601          Output timestamp in original ISO-8601 format (ex: 2022-02-22T10:10:10.1234567Z) (Always UTC)
      --RFC-2822          Output timestamp in RFC 2822 format (ex: Fri, 22 Feb 2022 22:00:00 -0600)
      --RFC-3339          Output timestamp in RFC 3339 format (ex: 2022-02-22 22:00:00.123456-06:00)
      --US-military-time  Output timestamp in US military time format (ex: 02-22-2022 22:00:00.123 -06:00)
      --US-time           Output timestamp in US time format (ex: 02-22-2022 10:00:00.123 PM -06:00)
  -U, --UTC               Output time in UTC format (default: local time)
Ejemplos del comando eid-metrics
- Imprimir métricas de ID de evento desde un solo archivo:
hayabusa.exe eid-metrics -f Security.evtx - Imprimir métricas de ID de evento desde un directorio:
hayabusa.exe eid-metrics -d ../logs - Guardar los resultados en un archivo CSV:
hayabusa.exe eid-metrics -f Security.evtx -o eid-metrics.csv
Archivo de configuración del comando eid-metrics
El canal, los IDs de evento y los títulos de los eventos están definidos en rules/config/channel_eid_info.txt.
Ejemplo:
Channel,EventID,EventTitle
Microsoft-Windows-Sysmon/Operational,1,Process Creation.
Microsoft-Windows-Sysmon/Operational,2,File Creation Timestamp Changed. (Possible Timestomping)
Microsoft-Windows-Sysmon/Operational,3,Network Connection.
Microsoft-Windows-Sysmon/Operational,4,Sysmon Service State Changed.
Captura de pantalla de eid-metrics
Comando expand-list
Extrae marcadores de posición expand de la carpeta de reglas.
Esto es útil al crear archivos de configuración para usar cualquier regla que use el modificador de campo expand.
Para usar reglas expand, solo necesita crear un archivo .txt con el nombre del modificador de campo expand en el directorio ./config/expand/, y poner todos los valores que desee comprobar dentro del archivo.
Por ejemplo, si la lógica de detection de la regla es:
detection:
    selection:
        EventID: 5145
        RelativeTargetName|contains: '\winreg'
    filter_main:
        IpAddress|expand: '%Admins_Workstations%'
    condition: selection and not filter_main
crearía el archivo de texto ./config/expand/Admins_Workstations.txt y pondría valores como:
Esto comprobaría esencialmente la misma lógica que:
Si el archivo de configuración no existe, Hayabusa aún cargará la regla expand pero la ignorará.
Usage:  expand-list <INPUT> [OPTIONS]

General Options:
  -h, --help              Show the help menu
  -r, --rules <DIR/FILE>  Specify rule directory (default: ./rules)

Display Settings:
  -K, --no-color  Disable color output
  -q, --quiet     Quiet mode: do not display the launch banner
Ejemplos del comando expand-list
- Extraer los modificadores de campo
expanddel directoriorulespredeterminado:hayabusa.exe expand-list - Extraer los modificadores de campo
expanddel directoriosigma:hayabusa.exe eid-metrics -r ../sigma
Resultados de expand-list
5 unique expand placeholders found:
Admins_Workstations
DC-MACHINE-NAME
Workstations
internal_domains
domain_controller_hostnames
Comando extract-base64
Este comando extraerá cadenas base64 de los siguientes eventos, las decodificará e indicará qué tipo de codificación se está usando. * Security 4688 CommandLine * Sysmon 1 CommandLine, ParentCommandLine * System 7045 ImagePath * PowerShell Operational 4104 * PowerShell Operational 4103
Usage:  extract-base64 <INPUT> [OPTIONS]

Input:
  -d, --directory <DIR>  Directory of multiple .evtx files
  -f, --file <FILE>      File path to one .evtx file
  -l, --live-analysis    Analyze the local C:\Windows\System32\winevt\Logs folder

General Options:
  -C, --clobber                        Overwrite files when saving
  -h, --help                           Show the help menu
  -J, --JSON-input                     Scan JSON formatted logs instead of .evtx (.json or .jsonl)
  -Q, --quiet-errors                   Quiet errors mode: do not save error logs
  -x, --recover-records                Carve evtx records from slack space (default: disabled)
  -c, --rules-config <DIR>             Specify custom rule config directory (default: ./rules/config)
  -t, --threads <NUMBER>               Number of threads (default: optimal number for performance)
      --target-file-ext <FILE-EXT...>  Specify additional evtx file extensions (ex: evtx_data)

Filtering:
      --exclude-computer <COMPUTER...>  Do not scan specified computer names (ex: ComputerA) (ex: ComputerA,ComputerB)
      --include-computer <COMPUTER...>  Scan only specified computer names (ex: ComputerA) (ex: ComputerA,ComputerB)
      --time-offset <OFFSET>            Scan recent events based on an offset (ex: 1y, 3M, 30d, 24h, 30m)

Output:
  -o, --output <FILE>  Extract Base64 strings

Display Settings:
  -K, --no-color  Disable color output
  -q, --quiet     Quiet mode: do not display the launch banner
  -v, --verbose   Output verbose information

Time Format:
      --European-time     Output timestamp in European time format (ex: 22-02-2022 22:00:00.123 +02:00)
  -O, --ISO-8601          Output timestamp in original ISO-8601 format (ex: 2022-02-22T10:10:10.1234567Z) (Always UTC)
      --RFC-2822          Output timestamp in RFC 2822 format (ex: Fri, 22 Feb 2022 22:00:00 -0600)
      --RFC-3339          Output timestamp in RFC 3339 format (ex: 2022-02-22 22:00:00.123456-06:00)
      --US-military-time  Output timestamp in US military time format (ex: 02-22-2022 22:00:00.123 -06:00)
      --US-time           Output timestamp in US time format (ex: 02-22-2022 10:00:00.123 PM -06:00)
  -U, --UTC               Output time in UTC format (default: local time)
Ejemplos del comando extract-base64
- Escanear un directorio y mostrar la salida en la terminal:
hayabusa.exe extract-base64 -d ../hayabusa-sample-evtx - Escanear un directorio y guardar la salida en un archivo CSV:
hayabusa.exe eid-metrics -r ../sigma -o base64-extracted.csv
Resultados de extract-base64
Al mostrar la salida en la terminal, debido a que el espacio es limitado, solo se muestran los siguientes campos: * Timestamp * Computer * Base64 String * Decoded String (if not binary)
Al guardar en un archivo CSV, se guardan los siguientes campos:
* Timestamp
* Computer
* Base64 String
* Decoded String (if not binary)
* Original Field
* Length
* Binary (Y/N)
* Double Encoding (when Y, it usually is malicious)
* Encoding Type
* File Type
* Event
* Record ID
* File Name
Comando log-metrics
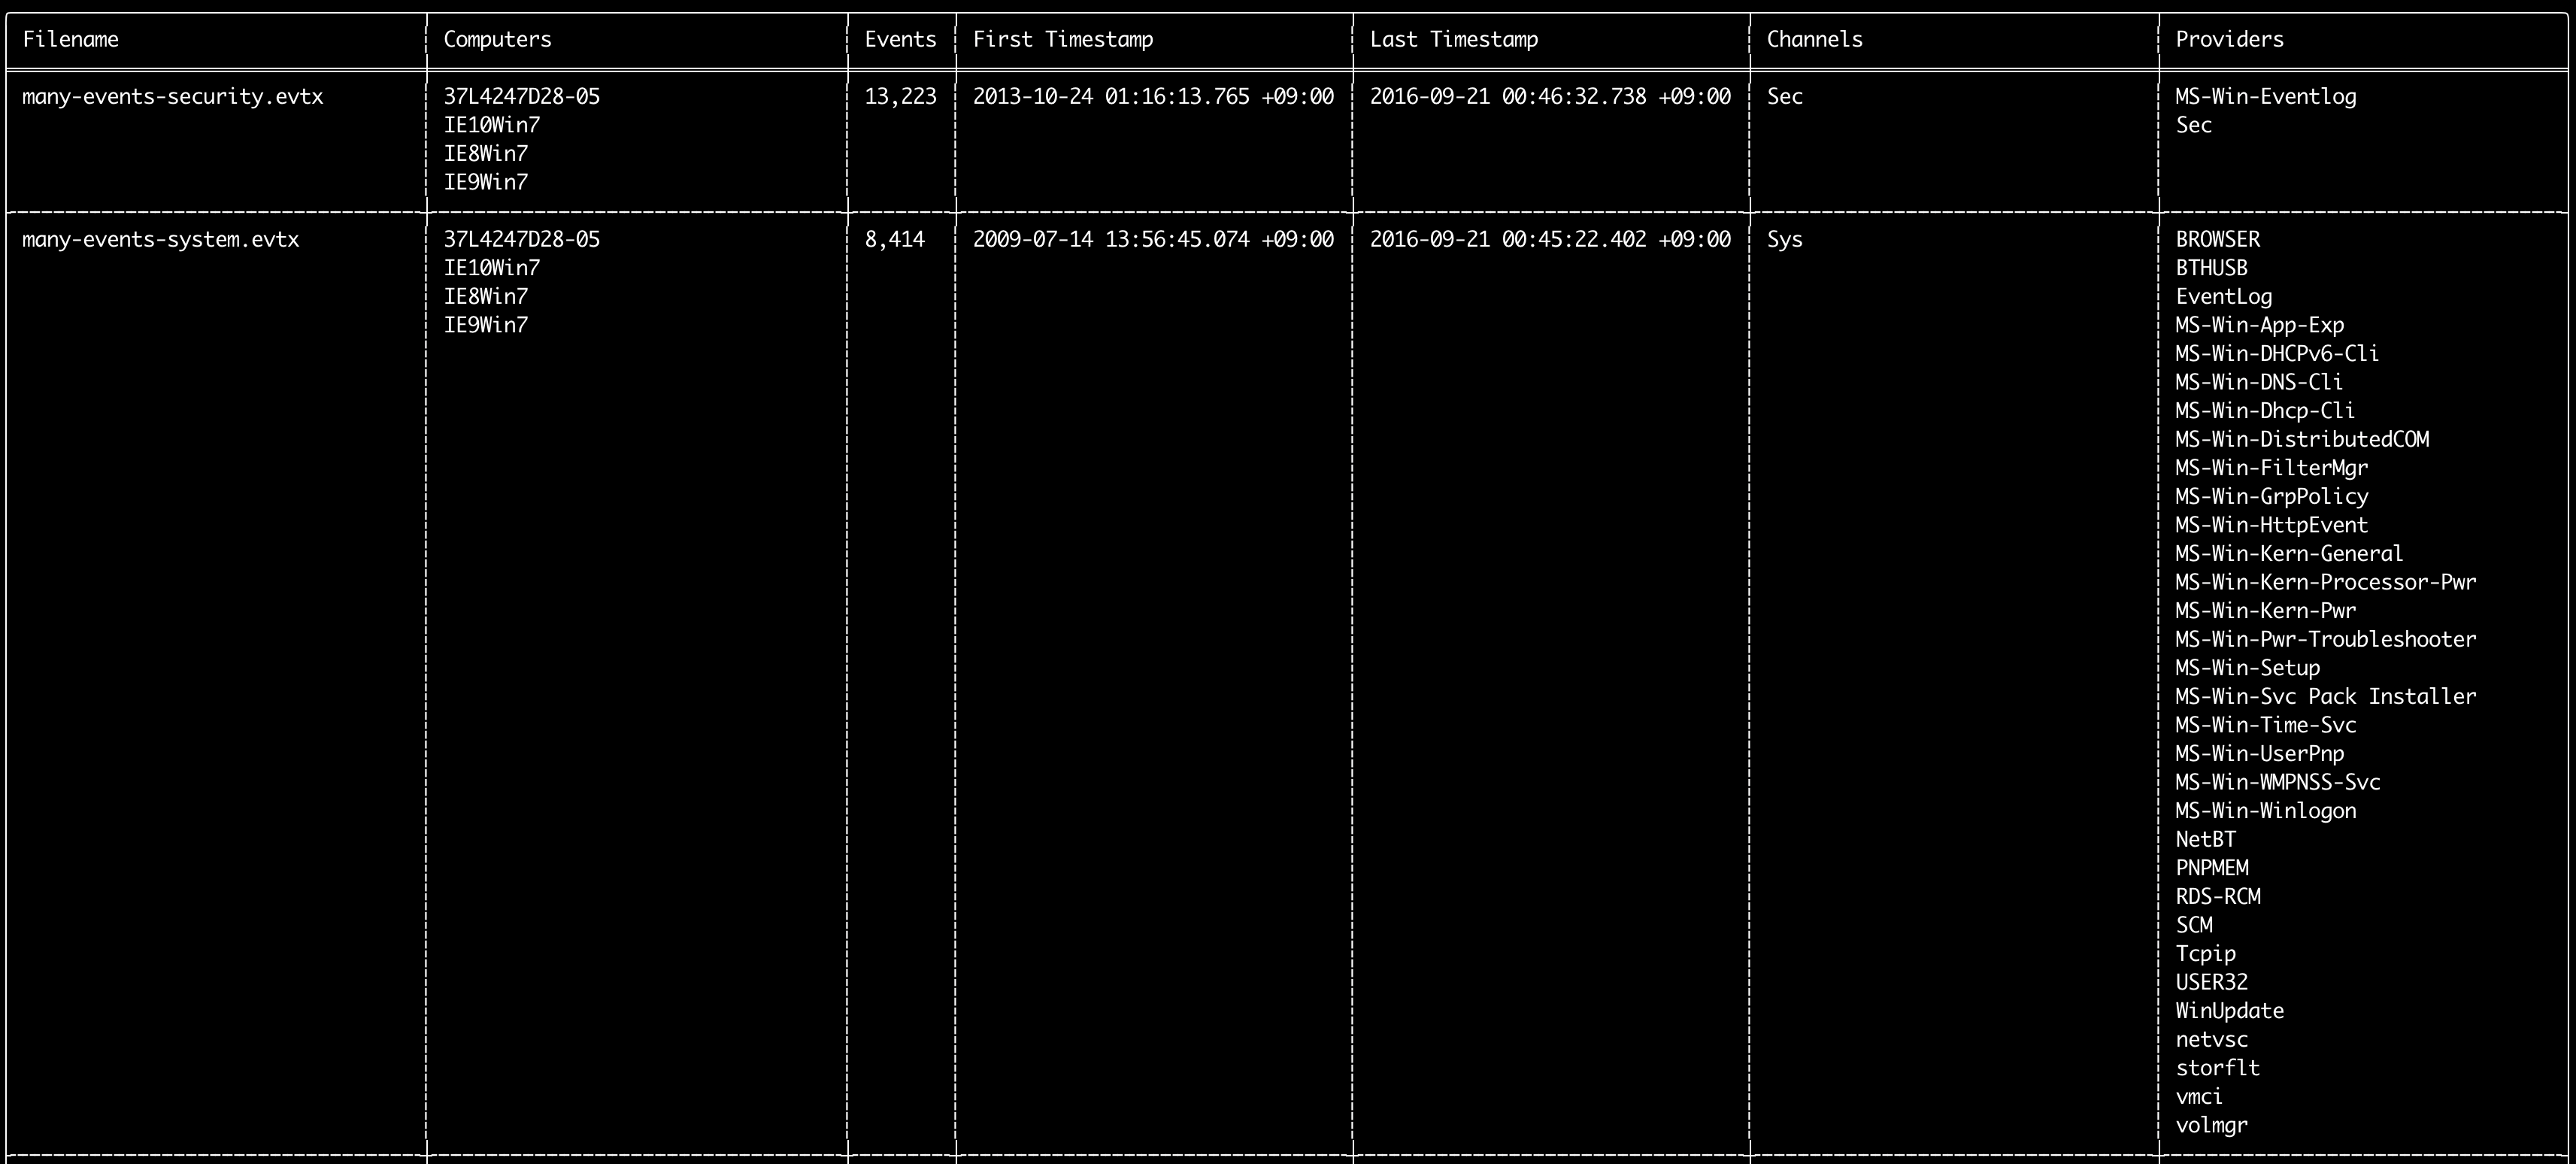
Puede usar el comando log-metrics para imprimir los siguientes metadatos dentro de los registros de eventos:
* Filename
* Computer names
* Number of events
* First timestamp
* Last timestamp
* Channels
* Providers
Este comando no usa ninguna regla de detección, por lo que escaneará todos los eventos.
Usage: log-metrics <INPUT> [OPTIONS]

Input:
  -d, --directory <DIR>  Directory of multiple .evtx files
  -f, --file <FILE>      File path to one .evtx file
  -l, --live-analysis    Analyze the local C:\Windows\System32\winevt\Logs folder

General Options:
  -C, --clobber                        Overwrite files when saving
  -h, --help                           Show the help menu
  -J, --JSON-input                     Scan JSON formatted logs instead of .evtx (.json or .jsonl)
  -Q, --quiet-errors                   Quiet errors mode: do not save error logs
  -x, --recover-records                Carve evtx records from slack space (default: disabled)
  -c, --rules-config <DIR>             Specify custom rule config directory (default: ./rules/config)
  -t, --threads <NUMBER>               Number of threads (default: optimal number for performance)
      --target-file-ext <FILE-EXT...>  Specify additional evtx file extensions (ex: evtx_data)

Filtering:
      --exclude-computer <COMPUTER...>  Do not scan specified computer names (ex: ComputerA) (ex: ComputerA,ComputerB)
      --include-computer <COMPUTER...>  Scan only specified computer names (ex: ComputerA) (ex: ComputerA,ComputerB)
      --time-offset <OFFSET>            Scan recent events based on an offset (ex: 1y, 3M, 30d, 24h, 30m)

Output:
  -b, --disable-abbreviations  Disable abbreviations
  -M, --multiline              Output event field information in multiple rows for CSV output
  -o, --output <FILE>          Save the Metrics in CSV format (ex: metrics.csv)
  -S, --tab-separator          Separate event field information by tabs

Display Settings:
  -K, --no-color  Disable color output
  -q, --quiet     Quiet mode: do not display the launch banner
  -v, --verbose   Output verbose information

Time Format:
      --European-time     Output timestamp in European time format (ex: 22-02-2022 22:00:00.123 +02:00)
  -O, --ISO-8601          Output timestamp in original ISO-8601 format (ex: 2022-02-22T10:10:10.1234567Z) (Always UTC)
      --RFC-2822          Output timestamp in RFC 2822 format (ex: Fri, 22 Feb 2022 22:00:00 -0600)
      --RFC-3339          Output timestamp in RFC 3339 format (ex: 2022-02-22 22:00:00.123456-06:00)
      --US-military-time  Output timestamp in US military time format (ex: 02-22-2022 22:00:00.123 -06:00)
      --US-time           Output timestamp in US time format (ex: 02-22-2022 10:00:00.123 PM -06:00)
  -U, --UTC               Output time in UTC format (default: local time)
Ejemplos del comando log-metrics
- Imprimir métricas de ID de evento desde un solo archivo:
hayabusa.exe log-metrics -f Security.evtx - Imprimir métricas de ID de evento desde un directorio:
hayabusa.exe log-metrics -d ../logs - Guardar los resultados en un archivo CSV:
hayabusa.exe log-metrics -d ../logs -o eid-metrics.csv
Captura de pantalla de log-metrics
Comando logon-summary
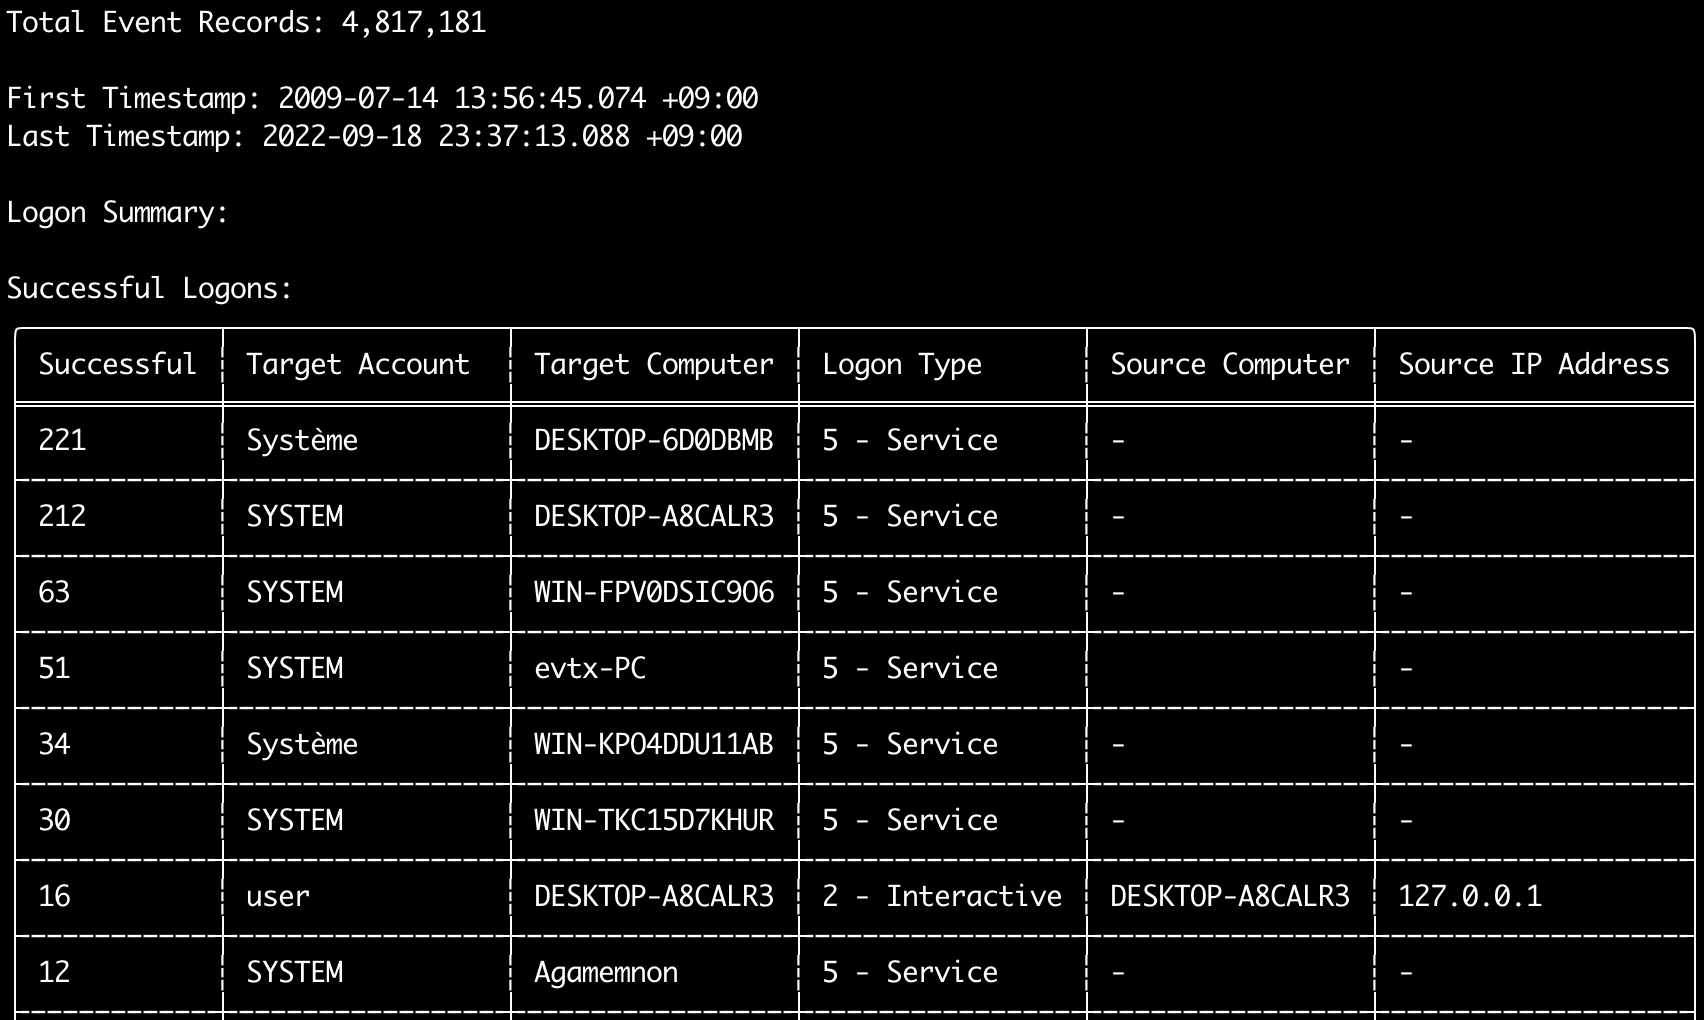
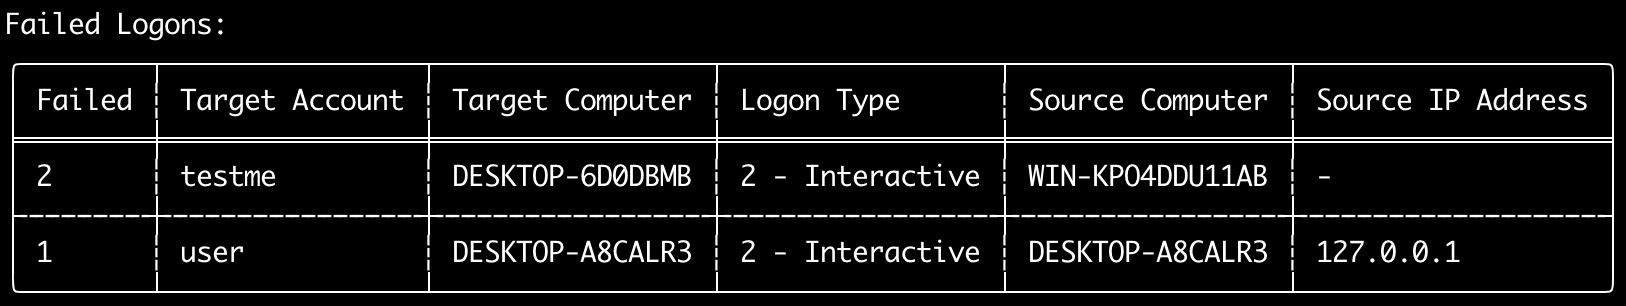
Puede usar el comando logon-summary para mostrar un resumen de la información de inicio de sesión (nombres de usuario de inicio de sesión y recuento de inicios de sesión exitosos y fallidos).
Puede mostrar la información de inicio de sesión de un archivo evtx con -f o de varios archivos evtx con la opción -d.
Los inicios de sesión exitosos se toman de los siguientes eventos:
* Security 4624 (Successful Logon)
* RDS-LSM 21 (Remote Desktop Service Local Session Manager Logon)
* RDS-GTW 302 (Remote Desktop Service Gateway Logon)
Los inicios de sesión fallidos se toman de los eventos Security 4625.
Usage: logon-summary <INPUT> [OPTIONS]

Input:
  -d, --directory <DIR>  Directory of multiple .evtx files
  -f, --file <FILE>      File path to one .evtx file
  -l, --live-analysis    Analyze the local C:\Windows\System32\winevt\Logs folder

General Options:
  -C, --clobber                        Overwrite files when saving
  -h, --help                           Show the help menu
  -J, --JSON-input                     Scan JSON formatted logs instead of .evtx (.json or .jsonl)
  -Q, --quiet-errors                   Quiet errors mode: do not save error logs
  -x, --recover-records                Carve evtx records from slack space (default: disabled)
  -c, --rules-config <DIR>             Specify custom rule config directory (default: ./rules/config)
  -t, --threads <NUMBER>               Number of threads (default: optimal number for performance)
      --target-file-ext <FILE-EXT...>  Specify additional evtx file extensions (ex: evtx_data)

Filtering:
      --exclude-computer <COMPUTER...>  Do not scan specified computer names (ex: ComputerA) (ex: ComputerA,ComputerB)
      --include-computer <COMPUTER...>  Scan only specified computer names (ex: ComputerA) (ex: ComputerA,ComputerB)
      --time-offset <OFFSET>            Scan recent events based on an offset (ex: 1y, 3M, 30d, 24h, 30m)
      --timeline-end <DATE>             End time of the event logs to load (ex: "2022-02-22 23:59:59 +09:00")
      --timeline-start <DATE>           Start time of the event logs to load (ex: "2020-02-22 00:00:00 +09:00")

Output:
  -o, --output <FILENAME-PREFIX>  Save the logon summary to two CSV files (ex: -o logon-summary)

Display Settings:
  -K, --no-color  Disable color output
  -q, --quiet     Quiet mode: do not display the launch banner
  -v, --verbose   Output verbose information

Time Format:
      --European-time     Output timestamp in European time format (ex: 22-02-2022 22:00:00.123 +02:00)
  -O, --ISO-8601          Output timestamp in original ISO-8601 format (ex: 2022-02-22T10:10:10.1234567Z) (Always UTC)
      --RFC-2822          Output timestamp in RFC 2822 format (ex: Fri, 22 Feb 2022 22:00:00 -0600)
      --RFC-3339          Output timestamp in RFC 3339 format (ex: 2022-02-22 22:00:00.123456-06:00)
      --US-military-time  Output timestamp in US military time format (ex: 02-22-2022 22:00:00.123 -06:00)
      --US-time           Output timestamp in US time format (ex: 02-22-2022 10:00:00.123 PM -06:00)
  -U, --UTC               Output time in UTC format (default: local time)
Ejemplos del comando logon-summary
- Imprimir el resumen de inicios de sesión:
hayabusa.exe logon-summary -f Security.evtx - Guardar los resultados del resumen de inicios de sesión:
hayabusa.exe logon-summary -d ../logs -o logon-summary.csv
Capturas de pantalla de logon-summary
Comando pivot-keywords-list
Puede usar el comando pivot-keywords-list para crear una lista de palabras clave de pivote únicas para identificar rápidamente usuarios, nombres de host, procesos, etc. anómalos, así como para correlacionar eventos.
Importante: de forma predeterminada, hayabusa devolverá resultados de todos los eventos (informativos y superiores), por lo que recomendamos encarecidamente combinar el comando pivot-keywords-list con la opción -m, --min-level.
Por ejemplo, comience creando palabras clave solo a partir de alertas critical con -m critical y luego continúe con -m high, -m medium, etc.
Lo más probable es que haya palabras clave comunes en sus resultados que coincidirán con muchos eventos normales, así que después de comprobar manualmente los resultados y crear una lista de palabras clave únicas en un solo archivo, puede crear una línea de tiempo reducida de actividad sospechosa con un comando como grep -f keywords.txt timeline.csv.
Usage: pivot-keywords-list <INPUT> [OPTIONS]

Input:
  -d, --directory <DIR>  Directory of multiple .evtx files
  -f, --file <FILE>      File path to one .evtx file
  -l, --live-analysis    Analyze the local C:\Windows\System32\winevt\Logs folder

General Options:
  -C, --clobber                        Overwrite files when saving
  -h, --help                           Show the help menu
  -J, --JSON-input                     Scan JSON formatted logs instead of .evtx (.json or .jsonl)
  -w, --no-wizard                      Do not ask questions. Scan for all events and alerts
  -Q, --quiet-errors                   Quiet errors mode: do not save error logs
  -x, --recover-records                Carve evtx records from slack space (default: disabled)
  -c, --rules-config <DIR>             Specify custom rule config directory (default: ./rules/config)
  -t, --threads <NUMBER>               Number of threads (default: optimal number for performance)
      --target-file-ext <FILE-EXT...>  Specify additional evtx file extensions (ex: evtx_data)

Filtering:
  -E, --EID-filter                      Scan only common EIDs for faster speed (./rules/config/target_event_IDs.txt)
  -D, --enable-deprecated-rules         Enable rules with a status of deprecated
  -n, --enable-noisy-rules              Enable rules set to noisy (./rules/config/noisy_rules.txt)
  -u, --enable-unsupported-rules        Enable rules with a status of unsupported
  -e, --exact-level <LEVEL>             Only load rules with a specific level (informational, low, medium, high, critical)
      --exclude-computer <COMPUTER...>  Do not scan specified computer names (ex: ComputerA) (ex: ComputerA,ComputerB)
      --exclude-eid <EID...>            Do not scan specific EIDs for faster speed (ex: 1) (ex: 1,4688)
      --exclude-status <STATUS...>      Do not load rules according to status (ex: experimental) (ex: stable,test)
      --exclude-tag <TAG...>            Do not load rules with specific tags (ex: sysmon)
      --include-computer <COMPUTER...>  Scan only specified computer names (ex: ComputerA) (ex: ComputerA,ComputerB)
      --include-eid <EID...>            Scan only specified EIDs for faster speed (ex: 1) (ex: 1,4688)
      --include-status <STATUS...>      Only load rules with specific status (ex: experimental) (ex: stable,test)
      --include-tag <TAG...>            Only load rules with specific tags (ex: attack.execution,attack.discovery)
  -m, --min-level <LEVEL>               Minimum level for rules to load (default: informational)
      --time-offset <OFFSET>            Scan recent events based on an offset (ex: 1y, 3M, 30d, 24h, 30m)
      --timeline-end <DATE>             End time of the event logs to load (ex: "2022-02-22 23:59:59 +09:00")
      --timeline-start <DATE>           Start time of the event logs to load (ex: "2020-02-22 00:00:00 +09:00")

Output:
  -o, --output <FILENAME-PREFIX>  Save pivot words to separate files (ex: PivotKeywords)

Display Settings:
  -K, --no-color  Disable color output
  -q, --quiet     Quiet mode: do not display the launch banner
  -v, --verbose   Output verbose information
Ejemplos del comando pivot-keywords-list
- Mostrar las palabras clave de pivote en pantalla:
hayabusa.exe pivot-keywords-list -d ../logs -m critical - Crear una lista de palabras clave de pivote a partir de alertas críticas y guardar los resultados. (Los resultados se guardarán en
keywords-Ip Addresses.txt,keywords-Users.txt, etc.):
Archivo de configuración de pivot-keywords-list
Puede personalizar qué palabras clave desea buscar editando ./rules/config/pivot_keywords.txt.
Esta página es la configuración predeterminada.
El formato es KeywordName.FieldName. Por ejemplo, al crear la lista de Users, hayabusa enumerará todos los valores en los campos SubjectUserName, TargetUserName y User.
Comando search
El comando search le permitirá realizar búsquedas por palabra clave en todos los eventos.
(No solo en los resultados de detección de Hayabusa.)
Esto es útil para determinar si hay alguna evidencia en eventos que no son detectados por Hayabusa.
Usage: hayabusa.exe search <INPUT> <--keywords "<KEYWORDS>" OR --regex "<REGEX>"> [OPTIONS]

Display Settings:
  -K, --no-color  Disable color output
  -q, --quiet     Quiet mode: do not display the launch banner
  -v, --verbose   Output verbose information

General Options:
  -C, --clobber                        Overwrite files when saving
  -h, --help                           Show the help menu
  -Q, --quiet-errors                   Quiet errors mode: do not save error logs
  -x, --recover-records                Carve evtx records from slack space (default: disabled)
  -c, --rules-config <DIR>             Specify custom rule config directory (default: ./rules/config)
  -t, --threads <NUMBER>               Number of threads (default: optimal number for performance)
      --target-file-ext <FILE-EXT...>  Specify additional evtx file extensions (ex: evtx_data)
  -s, --sort                           Sort results before saving the file (warning: this uses much more memory!)

Input:
  -d, --directory <DIR>  Directory of multiple .evtx files
  -f, --file <FILE>      File path to one .evtx file
  -l, --live-analysis    Analyze the local C:\Windows\System32\winevt\Logs folder

Filtering:
  -a, --and-logic              Search keywords with AND logic (default: OR)
  -F, --filter <FILTER...>     Filter by specific field(s)
  -i, --ignore-case            Case-insensitive keyword search
  -k, --keyword <KEYWORD...>   Search by keyword(s)
  -r, --regex <REGEX>          Search by regular expression
      --time-offset <OFFSET>   Scan recent events based on an offset (ex: 1y, 3M, 30d, 24h, 30m)
      --timeline-end <DATE>    End time of the event logs to load (ex: "2022-02-22 23:59:59 +09:00")
      --timeline-start <DATE>  Start time of the event logs to load (ex: "2020-02-22 00:00:00 +09:00")

Output:
  -b, --disable-abbreviations  Disable abbreviations
  -J, --JSON-output            Save the search results in JSON format (ex: -J -o results.json)
  -L, --JSONL-output           Save the search results in JSONL format (ex: -L -o results.jsonl)
  -M, --multiline              Output event field information in multiple rows for CSV output
  -o, --output <FILE>          Save the search results in CSV format (ex: search.csv)
  -S, --tab-separator          Separate event field information by tabs

Time Format:
      --European-time     Output timestamp in European time format (ex: 22-02-2022 22:00:00.123 +02:00)
  -O, --ISO-8601          Output timestamp in original ISO-8601 format (ex: 2022-02-22T10:10:10.1234567Z) (Always UTC)
      --RFC-2822          Output timestamp in RFC 2822 format (ex: Fri, 22 Feb 2022 22:00:00 -0600)
      --RFC-3339          Output timestamp in RFC 3339 format (ex: 2022-02-22 22:00:00.123456-06:00)
      --US-military-time  Output timestamp in US military time format (ex: 02-22-2022 22:00:00.123 -06:00)
      --US-time           Output timestamp in US time format (ex: 02-22-2022 10:00:00.123 PM -06:00)
  -U, --UTC               Output time in UTC format (default: local time)
Ejemplos del comando search
- Buscar la palabra clave
mimikatzen el directorio../hayabusa-sample-evtx:
Nota: La palabra clave coincidirá si se encuentra
mimikatzen cualquier parte de los datos. No es una coincidencia exacta.
- Buscar las palabras clave
mimikatzokalien el directorio../hayabusa-sample-evtx:
- Buscar la palabra clave
mimikatzen el directorio../hayabusa-sample-evtxe ignorar mayúsculas y minúsculas:
- Buscar direcciones IP usando expresiones regulares en el directorio
../hayabusa-sample-evtx:
- Buscar en el directorio
../hayabusa-sample-evtxy mostrar todos los eventos donde el campoWorkstationNameeskali:
Nota:
.*es la expresión regular para coincidir con cada evento.
Archivos de configuración del comando search
./rules/config/channel_abbreviations.txt: Asignaciones de nombres de canales y sus abreviaturas.