Comandos de Análise
Comando computer-metrics
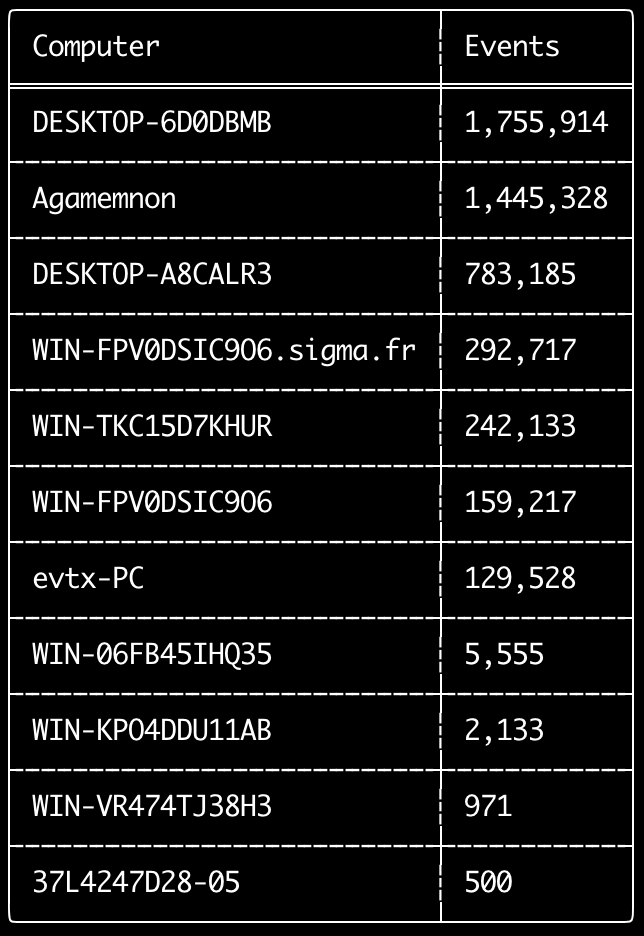
Você pode usar o comando computer-metrics para verificar quantos eventos existem de acordo com cada computador definido no campo <System><Computer>.
Esteja ciente de que você não pode confiar completamente no campo Computer para separar eventos por seu computador de origem.
O Windows 11 às vezes usa nomes de Computer completamente diferentes ao salvar nos registros de eventos.
Além disso, o Windows 10 às vezes registra o nome de Computer todo em letras minúsculas.
Este comando não usa nenhuma regra de detecção, portanto analisará todos os eventos.
Este é um bom comando para executar e ver rapidamente quais computadores possuem mais registros.
Com essa informação, você pode então usar as opções --include-computer ou --exclude-computer ao criar suas linhas do tempo para tornar a geração da sua linha do tempo mais eficiente, criando múltiplas linhas do tempo de acordo com o computador ou excluindo eventos de determinados computadores.
Usage: computer-metrics <INPUT> [OPTIONS]

Input:
  -d, --directory <DIR>  Directory of multiple .evtx files
  -f, --file <FILE>      File path to one .evtx file
  -l, --live-analysis    Analyze the local C:\Windows\System32\winevt\Logs folder

General Options:
  -C, --clobber                        Overwrite files when saving
  -h, --help                           Show the help menu
  -J, --JSON-input                     Scan JSON formatted logs instead of .evtx (.json or .jsonl)
  -Q, --quiet-errors                   Quiet errors mode: do not save error logs
  -x, --recover-records                Carve evtx records from slack space (default: disabled)
  -c, --rules-config <DIR>             Specify custom rule config directory (default: ./rules/config)
      --target-file-ext <FILE-EXT...>  Specify additional evtx file extensions (ex: evtx_data)
  -t, --threads <NUMBER>               Number of threads (default: optimal number for performance)

Filtering:
      --time-offset <OFFSET>  Scan recent events based on an offset (ex: 1y, 3M, 30d, 24h, 30m)

Output:
  -o, --output <FILE>  Save the results in CSV format (ex: computer-metrics.csv)

Display Settings:
  -K, --no-color  Disable color output
  -q, --quiet     Quiet mode: do not display the launch banner
  -v, --verbose   Output verbose information
Exemplos do comando computer-metrics
- Exibir métricas de nomes de computadores a partir de um diretório:
hayabusa.exe computer-metrics -d ../logs - Salvar os resultados em um arquivo CSV:
hayabusa.exe computer-metrics -d ../logs -o computer-metrics.csv
Captura de tela do computer-metrics
Comando eid-metrics
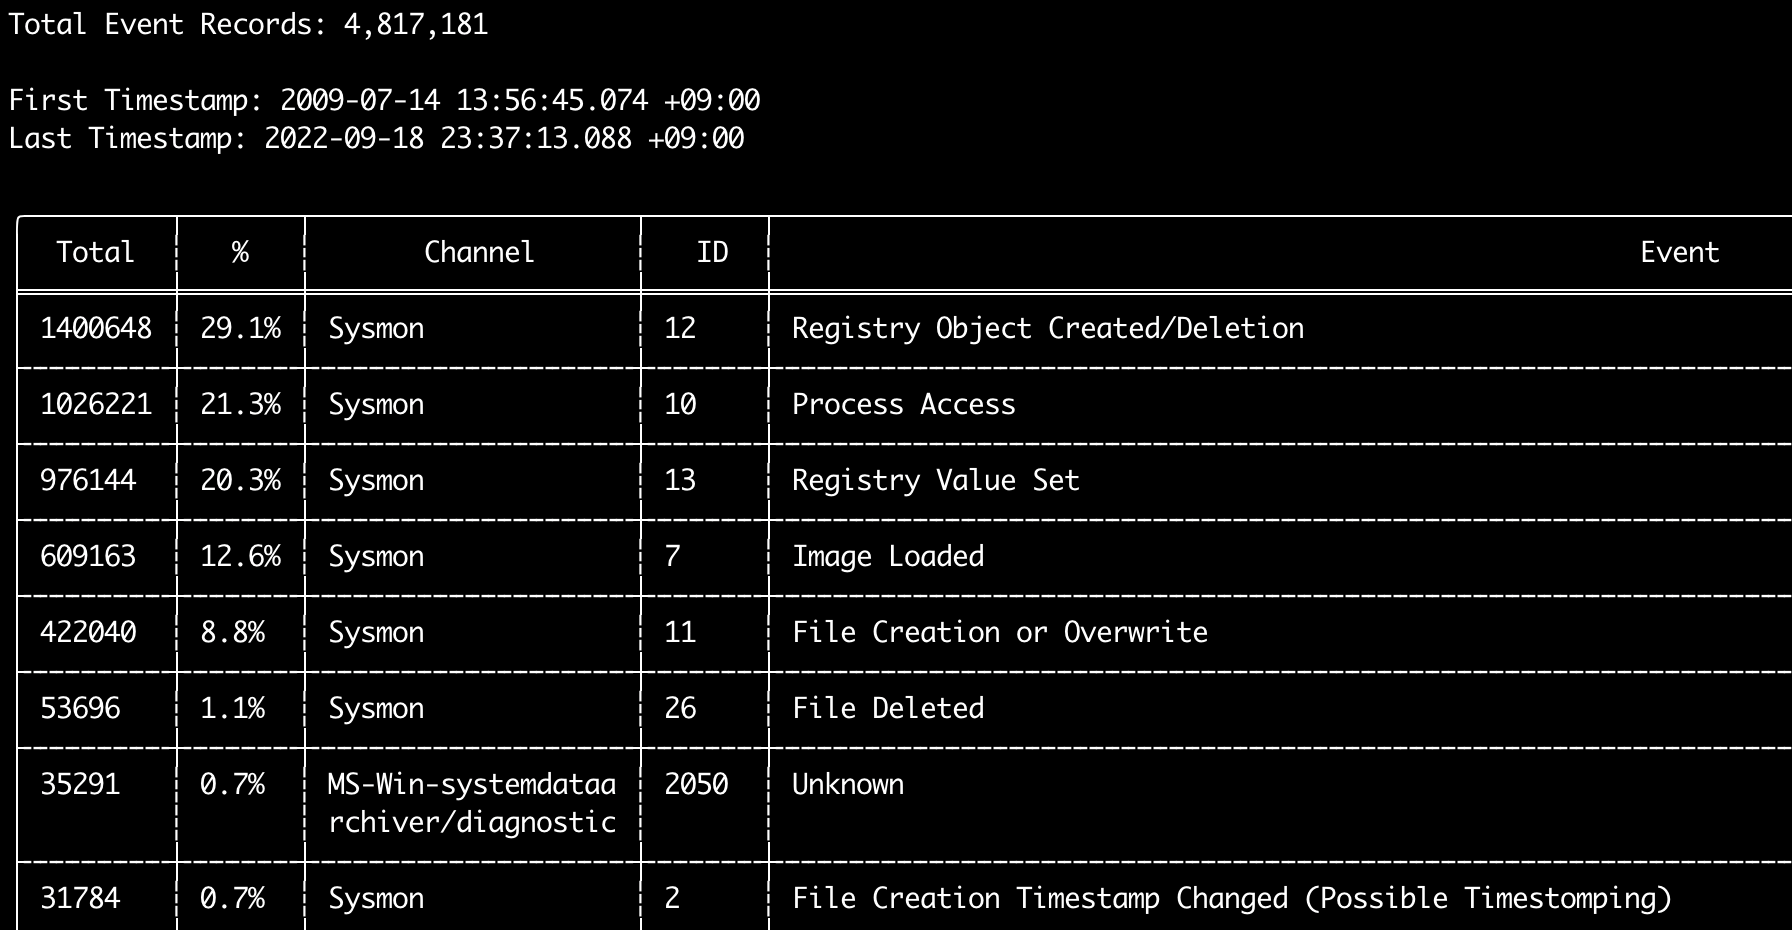
Você pode usar o comando eid-metrics para exibir o número total e a porcentagem de IDs de eventos (campo <System><EventID>) separados por canais.
Este comando não usa nenhuma regra de detecção, portanto escaneará todos os eventos.
Usage: eid-metrics <INPUT> [OPTIONS]

Input:
  -d, --directory <DIR>  Directory of multiple .evtx files
  -f, --file <FILE>      File path to one .evtx file
  -l, --live-analysis    Analyze the local C:\Windows\System32\winevt\Logs folder

General Options:
  -C, --clobber                        Overwrite files when saving
  -h, --help                           Show the help menu
  -J, --JSON-input                     Scan JSON formatted logs instead of .evtx (.json or .jsonl)
  -Q, --quiet-errors                   Quiet errors mode: do not save error logs
  -x, --recover-records                Carve evtx records from slack space (default: disabled)
  -c, --rules-config <DIR>             Specify custom rule config directory (default: ./rules/config)
  -t, --threads <NUMBER>               Number of threads (default: optimal number for performance)
      --target-file-ext <FILE-EXT...>  Specify additional evtx file extensions (ex: evtx_data)

Filtering:
      --exclude-computer <COMPUTER...>  Do not scan specified computer names (ex: ComputerA) (ex: ComputerA,ComputerB)
      --include-computer <COMPUTER...>  Scan only specified computer names (ex: ComputerA) (ex: ComputerA,ComputerB)
      --time-offset <OFFSET>            Scan recent events based on an offset (ex: 1y, 3M, 30d, 24h, 30m)

Output:
  -b, --disable-abbreviations  Disable abbreviations
  -o, --output <FILE>          Save the Metrics in CSV format (ex: metrics.csv)

Display Settings:
  -K, --no-color  Disable color output
  -q, --quiet     Quiet mode: do not display the launch banner
  -v, --verbose   Output verbose information

Time Format:
      --European-time     Output timestamp in European time format (ex: 22-02-2022 22:00:00.123 +02:00)
  -O, --ISO-8601          Output timestamp in original ISO-8601 format (ex: 2022-02-22T10:10:10.1234567Z) (Always UTC)
      --RFC-2822          Output timestamp in RFC 2822 format (ex: Fri, 22 Feb 2022 22:00:00 -0600)
      --RFC-3339          Output timestamp in RFC 3339 format (ex: 2022-02-22 22:00:00.123456-06:00)
      --US-military-time  Output timestamp in US military time format (ex: 02-22-2022 22:00:00.123 -06:00)
      --US-time           Output timestamp in US time format (ex: 02-22-2022 10:00:00.123 PM -06:00)
  -U, --UTC               Output time in UTC format (default: local time)
Exemplos do comando eid-metrics
- Exibir métricas de Event ID a partir de um único arquivo:
hayabusa.exe eid-metrics -f Security.evtx - Exibir métricas de Event ID a partir de um diretório:
hayabusa.exe eid-metrics -d ../logs - Salvar os resultados em um arquivo CSV:
hayabusa.exe eid-metrics -f Security.evtx -o eid-metrics.csv
Arquivo de configuração do comando eid-metrics
O canal, os IDs de eventos e os títulos dos eventos são definidos em rules/config/channel_eid_info.txt.
Exemplo:
Channel,EventID,EventTitle
Microsoft-Windows-Sysmon/Operational,1,Process Creation.
Microsoft-Windows-Sysmon/Operational,2,File Creation Timestamp Changed. (Possible Timestomping)
Microsoft-Windows-Sysmon/Operational,3,Network Connection.
Microsoft-Windows-Sysmon/Operational,4,Sysmon Service State Changed.
Captura de tela do eid-metrics
Comando expand-list
Extrai os marcadores expand da pasta de regras.
Isso é útil ao criar arquivos de configuração para usar qualquer regra que utilize o modificador de campo expand.
Para usar as regras expand, você só precisa criar um arquivo .txt com o nome do modificador de campo expand no diretório ./config/expand/, e colocar nele todos os valores que deseja verificar.
Por exemplo, se a lógica de detection da regra for:
detection:
    selection:
        EventID: 5145
        RelativeTargetName|contains: '\winreg'
    filter_main:
        IpAddress|expand: '%Admins_Workstations%'
    condition: selection and not filter_main
você criaria o arquivo de texto ./config/expand/Admins_Workstations.txt e colocaria valores como:
Isso essencialmente verificaria a mesma lógica que:
Se o arquivo de configuração não existir, o Hayabusa ainda carregará a regra expand, mas a ignorará.
Usage:  expand-list <INPUT> [OPTIONS]

General Options:
  -h, --help              Show the help menu
  -r, --rules <DIR/FILE>  Specify rule directory (default: ./rules)

Display Settings:
  -K, --no-color  Disable color output
  -q, --quiet     Quiet mode: do not display the launch banner
Exemplos do comando expand-list
- Extrair os modificadores de campo
expanddo diretório padrãorules:hayabusa.exe expand-list - Extrair os modificadores de campo
expanddo diretóriosigma:hayabusa.exe eid-metrics -r ../sigma
Resultados do expand-list
5 unique expand placeholders found:
Admins_Workstations
DC-MACHINE-NAME
Workstations
internal_domains
domain_controller_hostnames
Comando extract-base64
Este comando extrai strings base64 dos seguintes eventos, as decodifica e informa qual tipo de codificação está sendo utilizada. * Security 4688 CommandLine * Sysmon 1 CommandLine, ParentCommandLine * System 7045 ImagePath * PowerShell Operational 4104 * PowerShell Operational 4103
Usage:  extract-base64 <INPUT> [OPTIONS]

Input:
  -d, --directory <DIR>  Directory of multiple .evtx files
  -f, --file <FILE>      File path to one .evtx file
  -l, --live-analysis    Analyze the local C:\Windows\System32\winevt\Logs folder

General Options:
  -C, --clobber                        Overwrite files when saving
  -h, --help                           Show the help menu
  -J, --JSON-input                     Scan JSON formatted logs instead of .evtx (.json or .jsonl)
  -Q, --quiet-errors                   Quiet errors mode: do not save error logs
  -x, --recover-records                Carve evtx records from slack space (default: disabled)
  -c, --rules-config <DIR>             Specify custom rule config directory (default: ./rules/config)
  -t, --threads <NUMBER>               Number of threads (default: optimal number for performance)
      --target-file-ext <FILE-EXT...>  Specify additional evtx file extensions (ex: evtx_data)

Filtering:
      --exclude-computer <COMPUTER...>  Do not scan specified computer names (ex: ComputerA) (ex: ComputerA,ComputerB)
      --include-computer <COMPUTER...>  Scan only specified computer names (ex: ComputerA) (ex: ComputerA,ComputerB)
      --time-offset <OFFSET>            Scan recent events based on an offset (ex: 1y, 3M, 30d, 24h, 30m)

Output:
  -o, --output <FILE>  Extract Base64 strings

Display Settings:
  -K, --no-color  Disable color output
  -q, --quiet     Quiet mode: do not display the launch banner
  -v, --verbose   Output verbose information

Time Format:
      --European-time     Output timestamp in European time format (ex: 22-02-2022 22:00:00.123 +02:00)
  -O, --ISO-8601          Output timestamp in original ISO-8601 format (ex: 2022-02-22T10:10:10.1234567Z) (Always UTC)
      --RFC-2822          Output timestamp in RFC 2822 format (ex: Fri, 22 Feb 2022 22:00:00 -0600)
      --RFC-3339          Output timestamp in RFC 3339 format (ex: 2022-02-22 22:00:00.123456-06:00)
      --US-military-time  Output timestamp in US military time format (ex: 02-22-2022 22:00:00.123 -06:00)
      --US-time           Output timestamp in US time format (ex: 02-22-2022 10:00:00.123 PM -06:00)
  -U, --UTC               Output time in UTC format (default: local time)
Exemplos do comando extract-base64
- Escanear um diretório e exibir a saída no terminal:
hayabusa.exe extract-base64 -d ../hayabusa-sample-evtx - Escanear um diretório e gerar a saída em um arquivo CSV:
hayabusa.exe eid-metrics -r ../sigma -o base64-extracted.csv
Resultados do extract-base64
Ao exibir a saída no terminal, como o espaço é limitado, apenas os seguintes campos são exibidos: * Timestamp * Computer * Base64 String * Decoded String (if not binary)
Ao salvar em um arquivo CSV, os seguintes campos são salvos:
* Timestamp
* Computer
* Base64 String
* Decoded String (if not binary)
* Original Field
* Length
* Binary (Y/N)
* Double Encoding (when Y, it usually is malicious)
* Encoding Type
* File Type
* Event
* Record ID
* File Name
Comando log-metrics
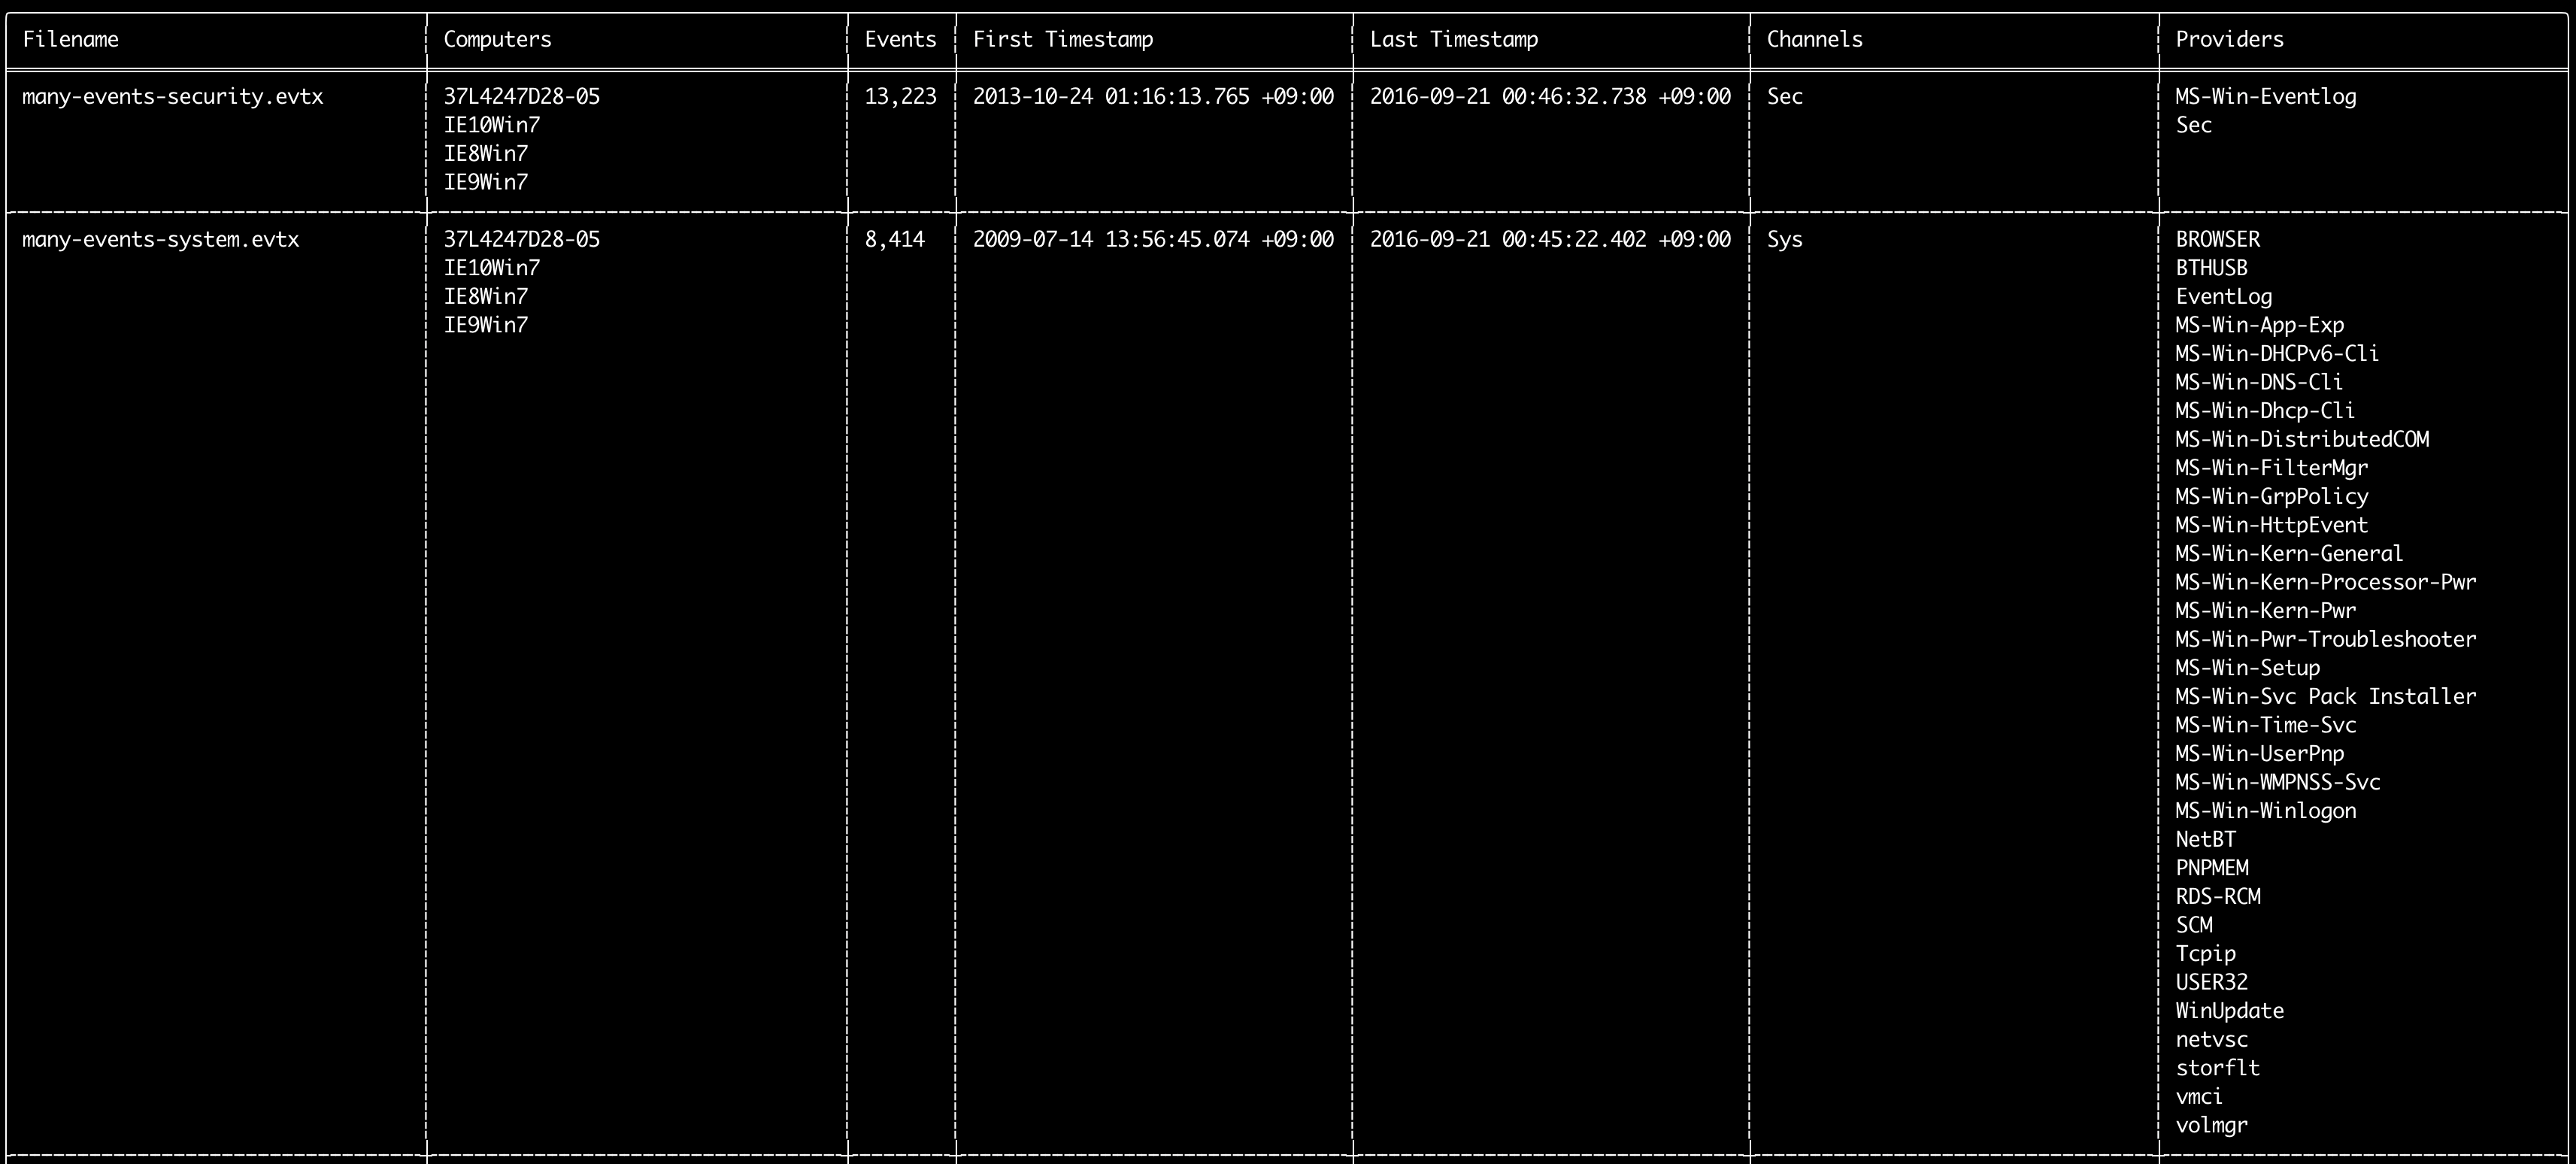
Você pode usar o comando log-metrics para exibir os seguintes metadados contidos nos registros de eventos:
* Filename
* Computer names
* Number of events
* First timestamp
* Last timestamp
* Channels
* Providers
Este comando não usa nenhuma regra de detecção, portanto escaneará todos os eventos.
Usage: log-metrics <INPUT> [OPTIONS]

Input:
  -d, --directory <DIR>  Directory of multiple .evtx files
  -f, --file <FILE>      File path to one .evtx file
  -l, --live-analysis    Analyze the local C:\Windows\System32\winevt\Logs folder

General Options:
  -C, --clobber                        Overwrite files when saving
  -h, --help                           Show the help menu
  -J, --JSON-input                     Scan JSON formatted logs instead of .evtx (.json or .jsonl)
  -Q, --quiet-errors                   Quiet errors mode: do not save error logs
  -x, --recover-records                Carve evtx records from slack space (default: disabled)
  -c, --rules-config <DIR>             Specify custom rule config directory (default: ./rules/config)
  -t, --threads <NUMBER>               Number of threads (default: optimal number for performance)
      --target-file-ext <FILE-EXT...>  Specify additional evtx file extensions (ex: evtx_data)

Filtering:
      --exclude-computer <COMPUTER...>  Do not scan specified computer names (ex: ComputerA) (ex: ComputerA,ComputerB)
      --include-computer <COMPUTER...>  Scan only specified computer names (ex: ComputerA) (ex: ComputerA,ComputerB)
      --time-offset <OFFSET>            Scan recent events based on an offset (ex: 1y, 3M, 30d, 24h, 30m)

Output:
  -b, --disable-abbreviations  Disable abbreviations
  -M, --multiline              Output event field information in multiple rows for CSV output
  -o, --output <FILE>          Save the Metrics in CSV format (ex: metrics.csv)
  -S, --tab-separator          Separate event field information by tabs

Display Settings:
  -K, --no-color  Disable color output
  -q, --quiet     Quiet mode: do not display the launch banner
  -v, --verbose   Output verbose information

Time Format:
      --European-time     Output timestamp in European time format (ex: 22-02-2022 22:00:00.123 +02:00)
  -O, --ISO-8601          Output timestamp in original ISO-8601 format (ex: 2022-02-22T10:10:10.1234567Z) (Always UTC)
      --RFC-2822          Output timestamp in RFC 2822 format (ex: Fri, 22 Feb 2022 22:00:00 -0600)
      --RFC-3339          Output timestamp in RFC 3339 format (ex: 2022-02-22 22:00:00.123456-06:00)
      --US-military-time  Output timestamp in US military time format (ex: 02-22-2022 22:00:00.123 -06:00)
      --US-time           Output timestamp in US time format (ex: 02-22-2022 10:00:00.123 PM -06:00)
  -U, --UTC               Output time in UTC format (default: local time)
Exemplos do comando log-metrics
- Exibir métricas de Event ID a partir de um único arquivo:
hayabusa.exe log-metrics -f Security.evtx - Exibir métricas de Event ID a partir de um diretório:
hayabusa.exe log-metrics -d ../logs - Salvar os resultados em um arquivo CSV:
hayabusa.exe log-metrics -d ../logs -o eid-metrics.csv
Captura de tela do log-metrics
Comando logon-summary
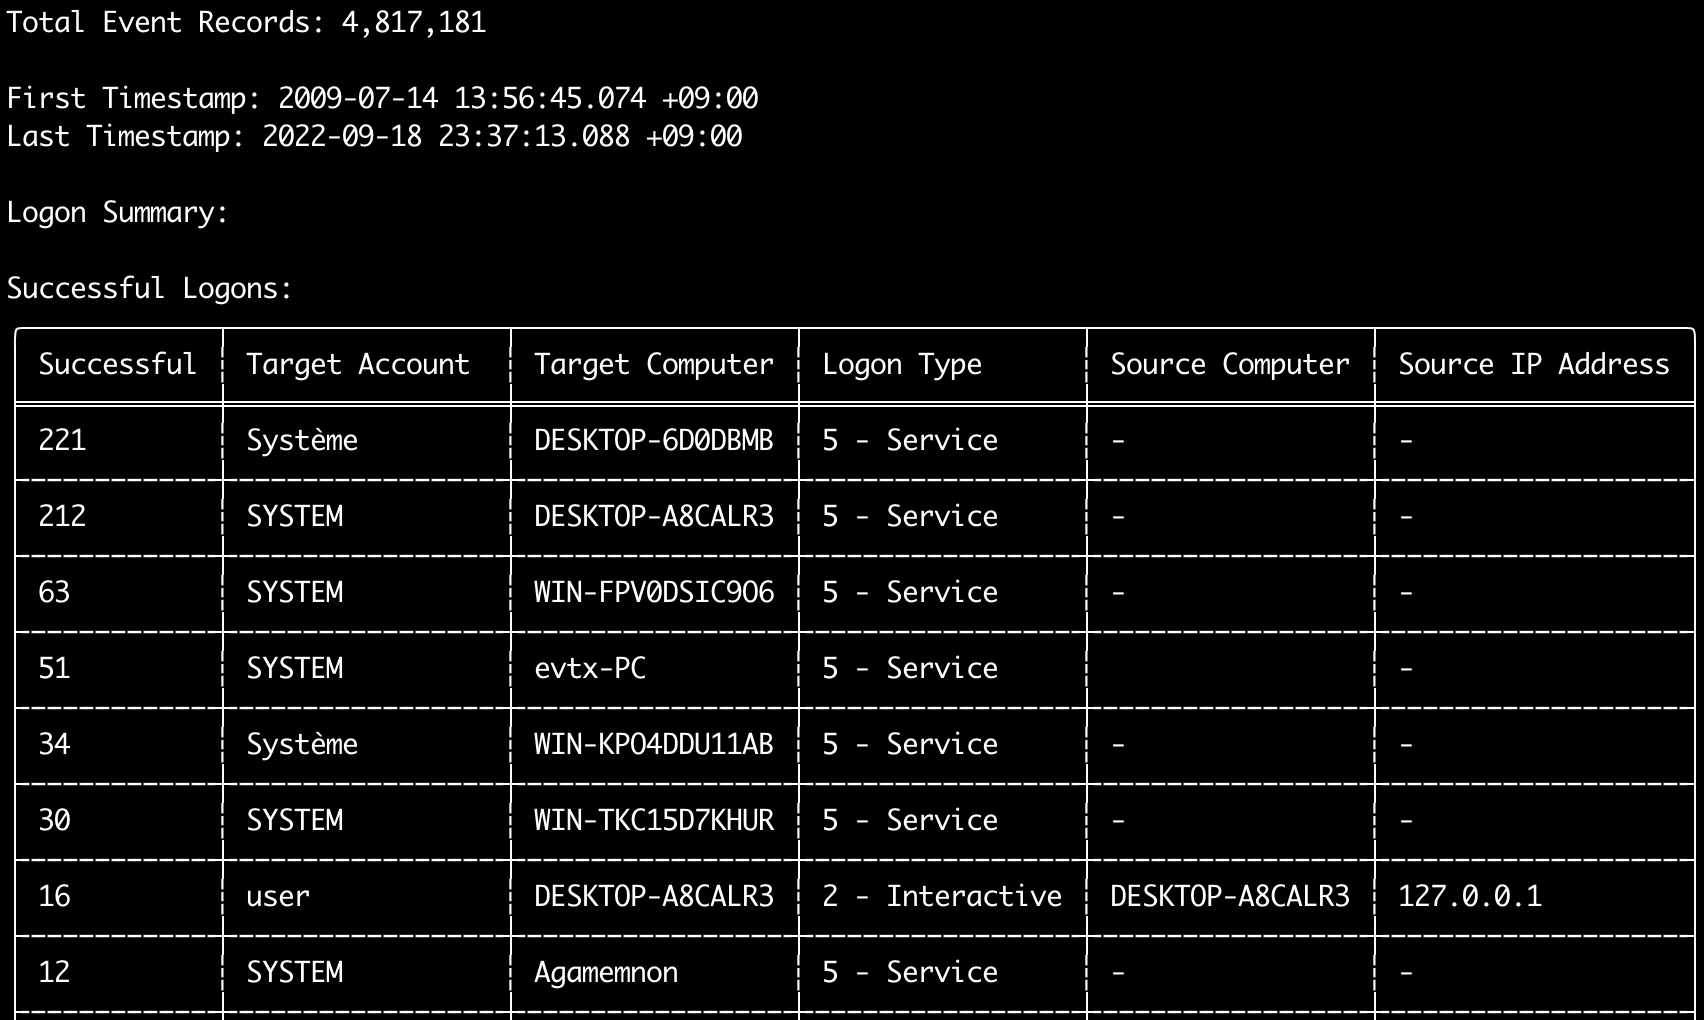
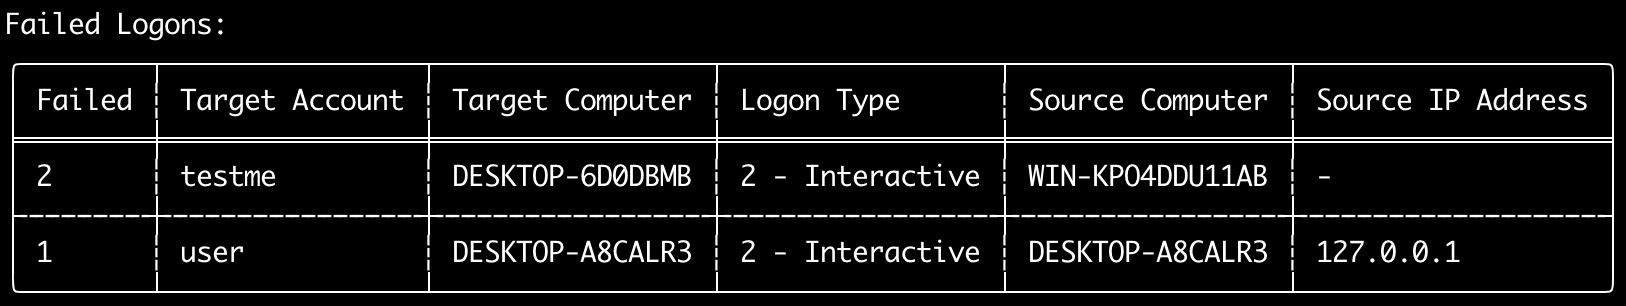
Você pode usar o comando logon-summary para gerar um resumo das informações de logon (nomes de usuários de logon e a contagem de logons bem-sucedidos e malsucedidos).
Você pode exibir as informações de logon de um arquivo evtx com -f ou de múltiplos arquivos evtx com a opção -d.
Logons bem-sucedidos são obtidos dos seguintes eventos:
* Security 4624 (Logon Bem-sucedido)
* RDS-LSM 21 (Logon no Gerenciador de Sessão Local do Serviço de Área de Trabalho Remota)
* RDS-GTW 302 (Logon no Gateway do Serviço de Área de Trabalho Remota)
Logons malsucedidos são obtidos dos eventos Security 4625.
Usage: logon-summary <INPUT> [OPTIONS]

Input:
  -d, --directory <DIR>  Directory of multiple .evtx files
  -f, --file <FILE>      File path to one .evtx file
  -l, --live-analysis    Analyze the local C:\Windows\System32\winevt\Logs folder

General Options:
  -C, --clobber                        Overwrite files when saving
  -h, --help                           Show the help menu
  -J, --JSON-input                     Scan JSON formatted logs instead of .evtx (.json or .jsonl)
  -Q, --quiet-errors                   Quiet errors mode: do not save error logs
  -x, --recover-records                Carve evtx records from slack space (default: disabled)
  -c, --rules-config <DIR>             Specify custom rule config directory (default: ./rules/config)
  -t, --threads <NUMBER>               Number of threads (default: optimal number for performance)
      --target-file-ext <FILE-EXT...>  Specify additional evtx file extensions (ex: evtx_data)

Filtering:
      --exclude-computer <COMPUTER...>  Do not scan specified computer names (ex: ComputerA) (ex: ComputerA,ComputerB)
      --include-computer <COMPUTER...>  Scan only specified computer names (ex: ComputerA) (ex: ComputerA,ComputerB)
      --time-offset <OFFSET>            Scan recent events based on an offset (ex: 1y, 3M, 30d, 24h, 30m)
      --timeline-end <DATE>             End time of the event logs to load (ex: "2022-02-22 23:59:59 +09:00")
      --timeline-start <DATE>           Start time of the event logs to load (ex: "2020-02-22 00:00:00 +09:00")

Output:
  -o, --output <FILENAME-PREFIX>  Save the logon summary to two CSV files (ex: -o logon-summary)

Display Settings:
  -K, --no-color  Disable color output
  -q, --quiet     Quiet mode: do not display the launch banner
  -v, --verbose   Output verbose information

Time Format:
      --European-time     Output timestamp in European time format (ex: 22-02-2022 22:00:00.123 +02:00)
  -O, --ISO-8601          Output timestamp in original ISO-8601 format (ex: 2022-02-22T10:10:10.1234567Z) (Always UTC)
      --RFC-2822          Output timestamp in RFC 2822 format (ex: Fri, 22 Feb 2022 22:00:00 -0600)
      --RFC-3339          Output timestamp in RFC 3339 format (ex: 2022-02-22 22:00:00.123456-06:00)
      --US-military-time  Output timestamp in US military time format (ex: 02-22-2022 22:00:00.123 -06:00)
      --US-time           Output timestamp in US time format (ex: 02-22-2022 10:00:00.123 PM -06:00)
  -U, --UTC               Output time in UTC format (default: local time)
Exemplos do comando logon-summary
- Exibir o resumo de logon:
hayabusa.exe logon-summary -f Security.evtx - Salvar os resultados do resumo de logon:
hayabusa.exe logon-summary -d ../logs -o logon-summary.csv
Capturas de tela do logon-summary
Comando pivot-keywords-list
Você pode usar o comando pivot-keywords-list para criar uma lista de palavras-chave de pivô exclusivas para identificar rapidamente usuários, nomes de host, processos, etc. anormais, bem como correlacionar eventos.
Importante: por padrão, o hayabusa retornará resultados de todos os eventos (informativos e superiores), portanto recomendamos fortemente combinar o comando pivot-keywords-list com a opção -m, --min-level.
Por exemplo, comece criando palavras-chave apenas a partir de alertas critical com -m critical e então continue com -m high, -m medium, etc.
Provavelmente haverá palavras-chave comuns em seus resultados que corresponderão a muitos eventos normais, portanto, após verificar manualmente os resultados e criar uma lista de palavras-chave exclusivas em um único arquivo, você pode então criar uma linha do tempo restrita de atividades suspeitas com um comando como grep -f keywords.txt timeline.csv.
Usage: pivot-keywords-list <INPUT> [OPTIONS]

Input:
  -d, --directory <DIR>  Directory of multiple .evtx files
  -f, --file <FILE>      File path to one .evtx file
  -l, --live-analysis    Analyze the local C:\Windows\System32\winevt\Logs folder

General Options:
  -C, --clobber                        Overwrite files when saving
  -h, --help                           Show the help menu
  -J, --JSON-input                     Scan JSON formatted logs instead of .evtx (.json or .jsonl)
  -w, --no-wizard                      Do not ask questions. Scan for all events and alerts
  -Q, --quiet-errors                   Quiet errors mode: do not save error logs
  -x, --recover-records                Carve evtx records from slack space (default: disabled)
  -c, --rules-config <DIR>             Specify custom rule config directory (default: ./rules/config)
  -t, --threads <NUMBER>               Number of threads (default: optimal number for performance)
      --target-file-ext <FILE-EXT...>  Specify additional evtx file extensions (ex: evtx_data)

Filtering:
  -E, --EID-filter                      Scan only common EIDs for faster speed (./rules/config/target_event_IDs.txt)
  -D, --enable-deprecated-rules         Enable rules with a status of deprecated
  -n, --enable-noisy-rules              Enable rules set to noisy (./rules/config/noisy_rules.txt)
  -u, --enable-unsupported-rules        Enable rules with a status of unsupported
  -e, --exact-level <LEVEL>             Only load rules with a specific level (informational, low, medium, high, critical)
      --exclude-computer <COMPUTER...>  Do not scan specified computer names (ex: ComputerA) (ex: ComputerA,ComputerB)
      --exclude-eid <EID...>            Do not scan specific EIDs for faster speed (ex: 1) (ex: 1,4688)
      --exclude-status <STATUS...>      Do not load rules according to status (ex: experimental) (ex: stable,test)
      --exclude-tag <TAG...>            Do not load rules with specific tags (ex: sysmon)
      --include-computer <COMPUTER...>  Scan only specified computer names (ex: ComputerA) (ex: ComputerA,ComputerB)
      --include-eid <EID...>            Scan only specified EIDs for faster speed (ex: 1) (ex: 1,4688)
      --include-status <STATUS...>      Only load rules with specific status (ex: experimental) (ex: stable,test)
      --include-tag <TAG...>            Only load rules with specific tags (ex: attack.execution,attack.discovery)
  -m, --min-level <LEVEL>               Minimum level for rules to load (default: informational)
      --time-offset <OFFSET>            Scan recent events based on an offset (ex: 1y, 3M, 30d, 24h, 30m)
      --timeline-end <DATE>             End time of the event logs to load (ex: "2022-02-22 23:59:59 +09:00")
      --timeline-start <DATE>           Start time of the event logs to load (ex: "2020-02-22 00:00:00 +09:00")

Output:
  -o, --output <FILENAME-PREFIX>  Save pivot words to separate files (ex: PivotKeywords)

Display Settings:
  -K, --no-color  Disable color output
  -q, --quiet     Quiet mode: do not display the launch banner
  -v, --verbose   Output verbose information
Exemplos do comando pivot-keywords-list
- Exibir palavras-chave de pivô na tela:
hayabusa.exe pivot-keywords-list -d ../logs -m critical - Criar uma lista de palavras-chave de pivô a partir de alertas críticos e salvar os resultados. (Os resultados serão salvos em
keywords-Ip Addresses.txt,keywords-Users.txt, etc.):
Arquivo de configuração do pivot-keywords-list
Você pode personalizar quais palavras-chave deseja pesquisar editando ./rules/config/pivot_keywords.txt.
Esta página é a configuração padrão.
O formato é KeywordName.FieldName. Por exemplo, ao criar a lista de Users, o hayabusa listará todos os valores dos campos SubjectUserName, TargetUserName e User.
Comando search
O comando search permite que você faça pesquisas por palavra-chave em todos os eventos.
(Não apenas nos resultados de detecção do Hayabusa.)
Isso é útil para determinar se há alguma evidência em eventos que não são detectados pelo Hayabusa.
Usage: hayabusa.exe search <INPUT> <--keywords "<KEYWORDS>" OR --regex "<REGEX>"> [OPTIONS]

Display Settings:
  -K, --no-color  Disable color output
  -q, --quiet     Quiet mode: do not display the launch banner
  -v, --verbose   Output verbose information

General Options:
  -C, --clobber                        Overwrite files when saving
  -h, --help                           Show the help menu
  -Q, --quiet-errors                   Quiet errors mode: do not save error logs
  -x, --recover-records                Carve evtx records from slack space (default: disabled)
  -c, --rules-config <DIR>             Specify custom rule config directory (default: ./rules/config)
  -t, --threads <NUMBER>               Number of threads (default: optimal number for performance)
      --target-file-ext <FILE-EXT...>  Specify additional evtx file extensions (ex: evtx_data)
  -s, --sort                           Sort results before saving the file (warning: this uses much more memory!)

Input:
  -d, --directory <DIR>  Directory of multiple .evtx files
  -f, --file <FILE>      File path to one .evtx file
  -l, --live-analysis    Analyze the local C:\Windows\System32\winevt\Logs folder

Filtering:
  -a, --and-logic              Search keywords with AND logic (default: OR)
  -F, --filter <FILTER...>     Filter by specific field(s)
  -i, --ignore-case            Case-insensitive keyword search
  -k, --keyword <KEYWORD...>   Search by keyword(s)
  -r, --regex <REGEX>          Search by regular expression
      --time-offset <OFFSET>   Scan recent events based on an offset (ex: 1y, 3M, 30d, 24h, 30m)
      --timeline-end <DATE>    End time of the event logs to load (ex: "2022-02-22 23:59:59 +09:00")
      --timeline-start <DATE>  Start time of the event logs to load (ex: "2020-02-22 00:00:00 +09:00")

Output:
  -b, --disable-abbreviations  Disable abbreviations
  -J, --JSON-output            Save the search results in JSON format (ex: -J -o results.json)
  -L, --JSONL-output           Save the search results in JSONL format (ex: -L -o results.jsonl)
  -M, --multiline              Output event field information in multiple rows for CSV output
  -o, --output <FILE>          Save the search results in CSV format (ex: search.csv)
  -S, --tab-separator          Separate event field information by tabs

Time Format:
      --European-time     Output timestamp in European time format (ex: 22-02-2022 22:00:00.123 +02:00)
  -O, --ISO-8601          Output timestamp in original ISO-8601 format (ex: 2022-02-22T10:10:10.1234567Z) (Always UTC)
      --RFC-2822          Output timestamp in RFC 2822 format (ex: Fri, 22 Feb 2022 22:00:00 -0600)
      --RFC-3339          Output timestamp in RFC 3339 format (ex: 2022-02-22 22:00:00.123456-06:00)
      --US-military-time  Output timestamp in US military time format (ex: 02-22-2022 22:00:00.123 -06:00)
      --US-time           Output timestamp in US time format (ex: 02-22-2022 10:00:00.123 PM -06:00)
  -U, --UTC               Output time in UTC format (default: local time)
Exemplos do comando search
- Pesquisar a palavra-chave
mimikatzno diretório../hayabusa-sample-evtx:
Nota: A palavra-chave corresponderá se
mimikatzfor encontrado em qualquer lugar dos dados. Não é uma correspondência exata.
- Pesquisar as palavras-chave
mimikatzoukalino diretório../hayabusa-sample-evtx:
- Pesquisar a palavra-chave
mimikatzno diretório../hayabusa-sample-evtxignorando maiúsculas e minúsculas:
- Pesquisar endereços IP no diretório
../hayabusa-sample-evtxusando expressões regulares:
- Pesquisar no diretório
../hayabusa-sample-evtxe exibir todos os eventos em que o campoWorkstationNameékali:
Nota:
.*é a expressão regular para corresponder a todos os eventos.
Arquivos de configuração do comando search
./rules/config/channel_abbreviations.txt: Mapeamentos de nomes de canais e suas abreviações.