Perintah Analisis
Perintah computer-metrics
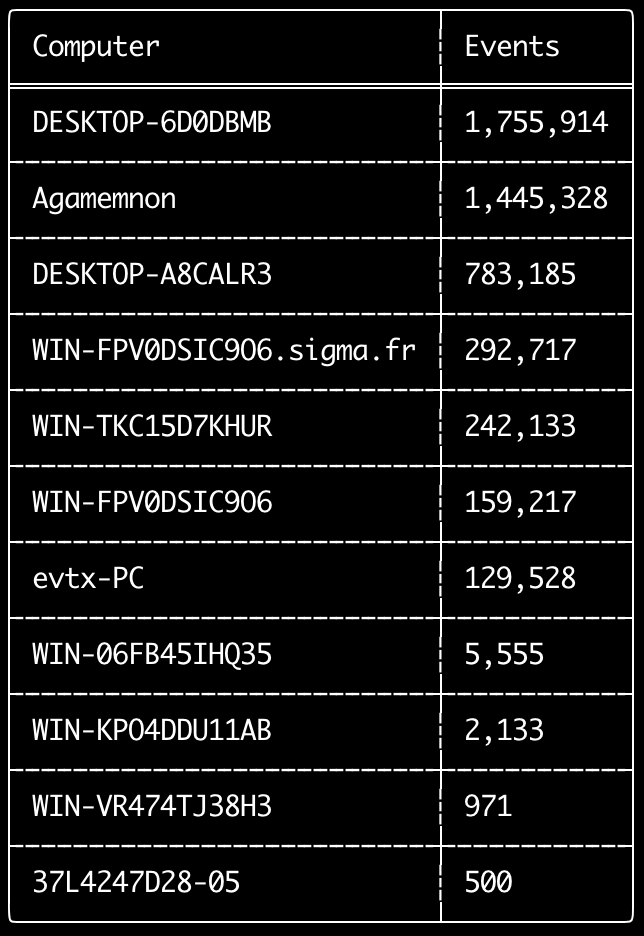
Anda dapat menggunakan perintah computer-metrics untuk memeriksa berapa banyak event yang ada menurut setiap komputer yang didefinisikan dalam field <System><Computer>.
Perlu diketahui bahwa Anda tidak dapat sepenuhnya mengandalkan field Computer untuk memisahkan event berdasarkan komputer asalnya.
Windows 11 terkadang menggunakan nama Computer yang sama sekali berbeda saat menyimpan ke event log.
Selain itu, Windows 10 terkadang mencatat nama Computer dalam huruf kecil semua.
Perintah ini tidak menggunakan aturan deteksi apa pun sehingga akan menganalisis semua event.
Ini adalah perintah yang baik untuk dijalankan untuk dengan cepat melihat komputer mana yang memiliki log paling banyak.
Dengan informasi ini, Anda kemudian dapat menggunakan opsi --include-computer atau --exclude-computer saat membuat timeline Anda untuk membuat pembuatan timeline Anda lebih efisien dengan membuat beberapa timeline menurut komputer atau mengecualikan event dari komputer tertentu.
Usage: computer-metrics <INPUT> [OPTIONS]

Input:
  -d, --directory <DIR>  Directory of multiple .evtx files
  -f, --file <FILE>      File path to one .evtx file
  -l, --live-analysis    Analyze the local C:\Windows\System32\winevt\Logs folder

General Options:
  -C, --clobber                        Overwrite files when saving
  -h, --help                           Show the help menu
  -J, --JSON-input                     Scan JSON formatted logs instead of .evtx (.json or .jsonl)
  -Q, --quiet-errors                   Quiet errors mode: do not save error logs
  -x, --recover-records                Carve evtx records from slack space (default: disabled)
  -c, --rules-config <DIR>             Specify custom rule config directory (default: ./rules/config)
      --target-file-ext <FILE-EXT...>  Specify additional evtx file extensions (ex: evtx_data)
  -t, --threads <NUMBER>               Number of threads (default: optimal number for performance)

Filtering:
      --time-offset <OFFSET>  Scan recent events based on an offset (ex: 1y, 3M, 30d, 24h, 30m)

Output:
  -o, --output <FILE>  Save the results in CSV format (ex: computer-metrics.csv)

Display Settings:
  -K, --no-color  Disable color output
  -q, --quiet     Quiet mode: do not display the launch banner
  -v, --verbose   Output verbose information
Contoh perintah computer-metrics
- Cetak metrik nama komputer dari sebuah direktori:
hayabusa.exe computer-metrics -d ../logs - Simpan hasil ke file CSV:
hayabusa.exe computer-metrics -d ../logs -o computer-metrics.csv
Tangkapan layar computer-metrics
Perintah eid-metrics
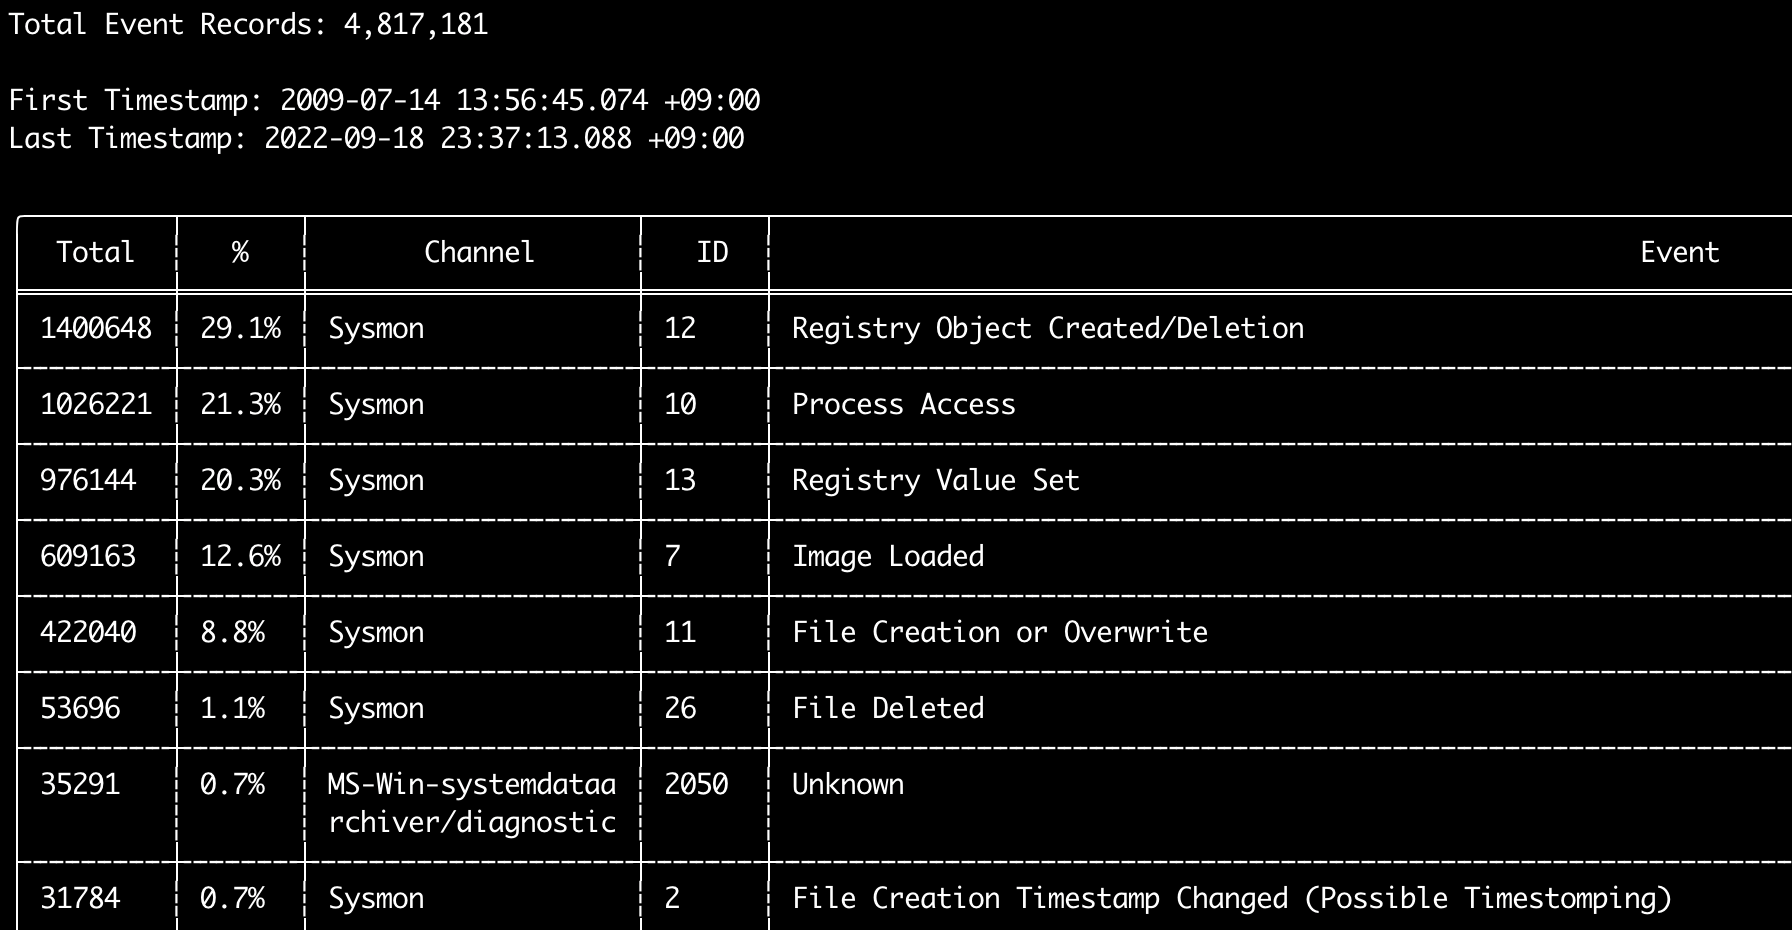
Anda dapat menggunakan perintah eid-metrics untuk mencetak jumlah total dan persentase event ID (field <System><EventID>) yang dipisahkan berdasarkan channel.
Perintah ini tidak menggunakan aturan deteksi apa pun sehingga akan memindai semua event.
Usage: eid-metrics <INPUT> [OPTIONS]

Input:
  -d, --directory <DIR>  Directory of multiple .evtx files
  -f, --file <FILE>      File path to one .evtx file
  -l, --live-analysis    Analyze the local C:\Windows\System32\winevt\Logs folder

General Options:
  -C, --clobber                        Overwrite files when saving
  -h, --help                           Show the help menu
  -J, --JSON-input                     Scan JSON formatted logs instead of .evtx (.json or .jsonl)
  -Q, --quiet-errors                   Quiet errors mode: do not save error logs
  -x, --recover-records                Carve evtx records from slack space (default: disabled)
  -c, --rules-config <DIR>             Specify custom rule config directory (default: ./rules/config)
  -t, --threads <NUMBER>               Number of threads (default: optimal number for performance)
      --target-file-ext <FILE-EXT...>  Specify additional evtx file extensions (ex: evtx_data)

Filtering:
      --exclude-computer <COMPUTER...>  Do not scan specified computer names (ex: ComputerA) (ex: ComputerA,ComputerB)
      --include-computer <COMPUTER...>  Scan only specified computer names (ex: ComputerA) (ex: ComputerA,ComputerB)
      --time-offset <OFFSET>            Scan recent events based on an offset (ex: 1y, 3M, 30d, 24h, 30m)

Output:
  -b, --disable-abbreviations  Disable abbreviations
  -o, --output <FILE>          Save the Metrics in CSV format (ex: metrics.csv)

Display Settings:
  -K, --no-color  Disable color output
  -q, --quiet     Quiet mode: do not display the launch banner
  -v, --verbose   Output verbose information

Time Format:
      --European-time     Output timestamp in European time format (ex: 22-02-2022 22:00:00.123 +02:00)
  -O, --ISO-8601          Output timestamp in original ISO-8601 format (ex: 2022-02-22T10:10:10.1234567Z) (Always UTC)
      --RFC-2822          Output timestamp in RFC 2822 format (ex: Fri, 22 Feb 2022 22:00:00 -0600)
      --RFC-3339          Output timestamp in RFC 3339 format (ex: 2022-02-22 22:00:00.123456-06:00)
      --US-military-time  Output timestamp in US military time format (ex: 02-22-2022 22:00:00.123 -06:00)
      --US-time           Output timestamp in US time format (ex: 02-22-2022 10:00:00.123 PM -06:00)
  -U, --UTC               Output time in UTC format (default: local time)
Contoh perintah eid-metrics
- Cetak metrik Event ID dari satu file:
hayabusa.exe eid-metrics -f Security.evtx - Cetak metrik Event ID dari sebuah direktori:
hayabusa.exe eid-metrics -d ../logs - Simpan hasil ke file CSV:
hayabusa.exe eid-metrics -f Security.evtx -o eid-metrics.csv
File konfigurasi perintah eid-metrics
Channel, event ID, dan judul event didefinisikan dalam rules/config/channel_eid_info.txt.
Contoh:
Channel,EventID,EventTitle
Microsoft-Windows-Sysmon/Operational,1,Process Creation.
Microsoft-Windows-Sysmon/Operational,2,File Creation Timestamp Changed. (Possible Timestomping)
Microsoft-Windows-Sysmon/Operational,3,Network Connection.
Microsoft-Windows-Sysmon/Operational,4,Sysmon Service State Changed.
Tangkapan layar eid-metrics
Perintah expand-list
Ekstrak placeholder expand dari folder rules.
Ini berguna saat membuat file konfigurasi untuk menggunakan aturan apa pun yang menggunakan field modifier expand.
Untuk menggunakan aturan expand, Anda hanya perlu membuat file .txt dengan nama field modifier expand di bawah direktori ./config/expand/, dan memasukkan semua nilai yang ingin Anda periksa ke dalam file tersebut.
Misalnya, jika logika detection dari aturan tersebut adalah:
detection:
    selection:
        EventID: 5145
        RelativeTargetName|contains: '\winreg'
    filter_main:
        IpAddress|expand: '%Admins_Workstations%'
    condition: selection and not filter_main
Anda akan membuat file teks ./config/expand/Admins_Workstations.txt dan memasukkan nilai seperti:
Ini pada dasarnya akan memeriksa logika yang sama seperti:
Jika file konfigurasi tidak ada, Hayabusa akan tetap memuat aturan expand tetapi mengabaikannya.
Usage:  expand-list <INPUT> [OPTIONS]

General Options:
  -h, --help              Show the help menu
  -r, --rules <DIR/FILE>  Specify rule directory (default: ./rules)

Display Settings:
  -K, --no-color  Disable color output
  -q, --quiet     Quiet mode: do not display the launch banner
Contoh perintah expand-list
- Ekstrak field modifier
expanddari direktorirulesdefault:hayabusa.exe expand-list - Ekstrak field modifier
expanddari direktorisigma:hayabusa.exe eid-metrics -r ../sigma
Hasil expand-list
5 unique expand placeholders found:
Admins_Workstations
DC-MACHINE-NAME
Workstations
internal_domains
domain_controller_hostnames
Perintah extract-base64
Perintah ini akan mengekstrak string base64 dari event berikut, mendekodekannya, dan memberi tahu jenis encoding apa yang digunakan. * Security 4688 CommandLine * Sysmon 1 CommandLine, ParentCommandLine * System 7045 ImagePath * PowerShell Operational 4104 * PowerShell Operational 4103
Usage:  extract-base64 <INPUT> [OPTIONS]

Input:
  -d, --directory <DIR>  Directory of multiple .evtx files
  -f, --file <FILE>      File path to one .evtx file
  -l, --live-analysis    Analyze the local C:\Windows\System32\winevt\Logs folder

General Options:
  -C, --clobber                        Overwrite files when saving
  -h, --help                           Show the help menu
  -J, --JSON-input                     Scan JSON formatted logs instead of .evtx (.json or .jsonl)
  -Q, --quiet-errors                   Quiet errors mode: do not save error logs
  -x, --recover-records                Carve evtx records from slack space (default: disabled)
  -c, --rules-config <DIR>             Specify custom rule config directory (default: ./rules/config)
  -t, --threads <NUMBER>               Number of threads (default: optimal number for performance)
      --target-file-ext <FILE-EXT...>  Specify additional evtx file extensions (ex: evtx_data)

Filtering:
      --exclude-computer <COMPUTER...>  Do not scan specified computer names (ex: ComputerA) (ex: ComputerA,ComputerB)
      --include-computer <COMPUTER...>  Scan only specified computer names (ex: ComputerA) (ex: ComputerA,ComputerB)
      --time-offset <OFFSET>            Scan recent events based on an offset (ex: 1y, 3M, 30d, 24h, 30m)

Output:
  -o, --output <FILE>  Extract Base64 strings

Display Settings:
  -K, --no-color  Disable color output
  -q, --quiet     Quiet mode: do not display the launch banner
  -v, --verbose   Output verbose information

Time Format:
      --European-time     Output timestamp in European time format (ex: 22-02-2022 22:00:00.123 +02:00)
  -O, --ISO-8601          Output timestamp in original ISO-8601 format (ex: 2022-02-22T10:10:10.1234567Z) (Always UTC)
      --RFC-2822          Output timestamp in RFC 2822 format (ex: Fri, 22 Feb 2022 22:00:00 -0600)
      --RFC-3339          Output timestamp in RFC 3339 format (ex: 2022-02-22 22:00:00.123456-06:00)
      --US-military-time  Output timestamp in US military time format (ex: 02-22-2022 22:00:00.123 -06:00)
      --US-time           Output timestamp in US time format (ex: 02-22-2022 10:00:00.123 PM -06:00)
  -U, --UTC               Output time in UTC format (default: local time)
Contoh perintah extract-base64
- Pindai direktori dan keluarkan ke terminal:
hayabusa.exe extract-base64 -d ../hayabusa-sample-evtx - Pindai direktori dan keluarkan ke file CSV:
hayabusa.exe eid-metrics -r ../sigma -o base64-extracted.csv
Hasil extract-base64
Saat mengeluarkan ke terminal, karena ruang terbatas, hanya field berikut yang ditampilkan: * Timestamp * Computer * Base64 String * Decoded String (if not binary)
Saat menyimpan ke file CSV, field berikut disimpan:
* Timestamp
* Computer
* Base64 String
* Decoded String (if not binary)
* Original Field
* Length
* Binary (Y/N)
* Double Encoding (when Y, it usually is malicious)
* Encoding Type
* File Type
* Event
* Record ID
* File Name
Perintah log-metrics
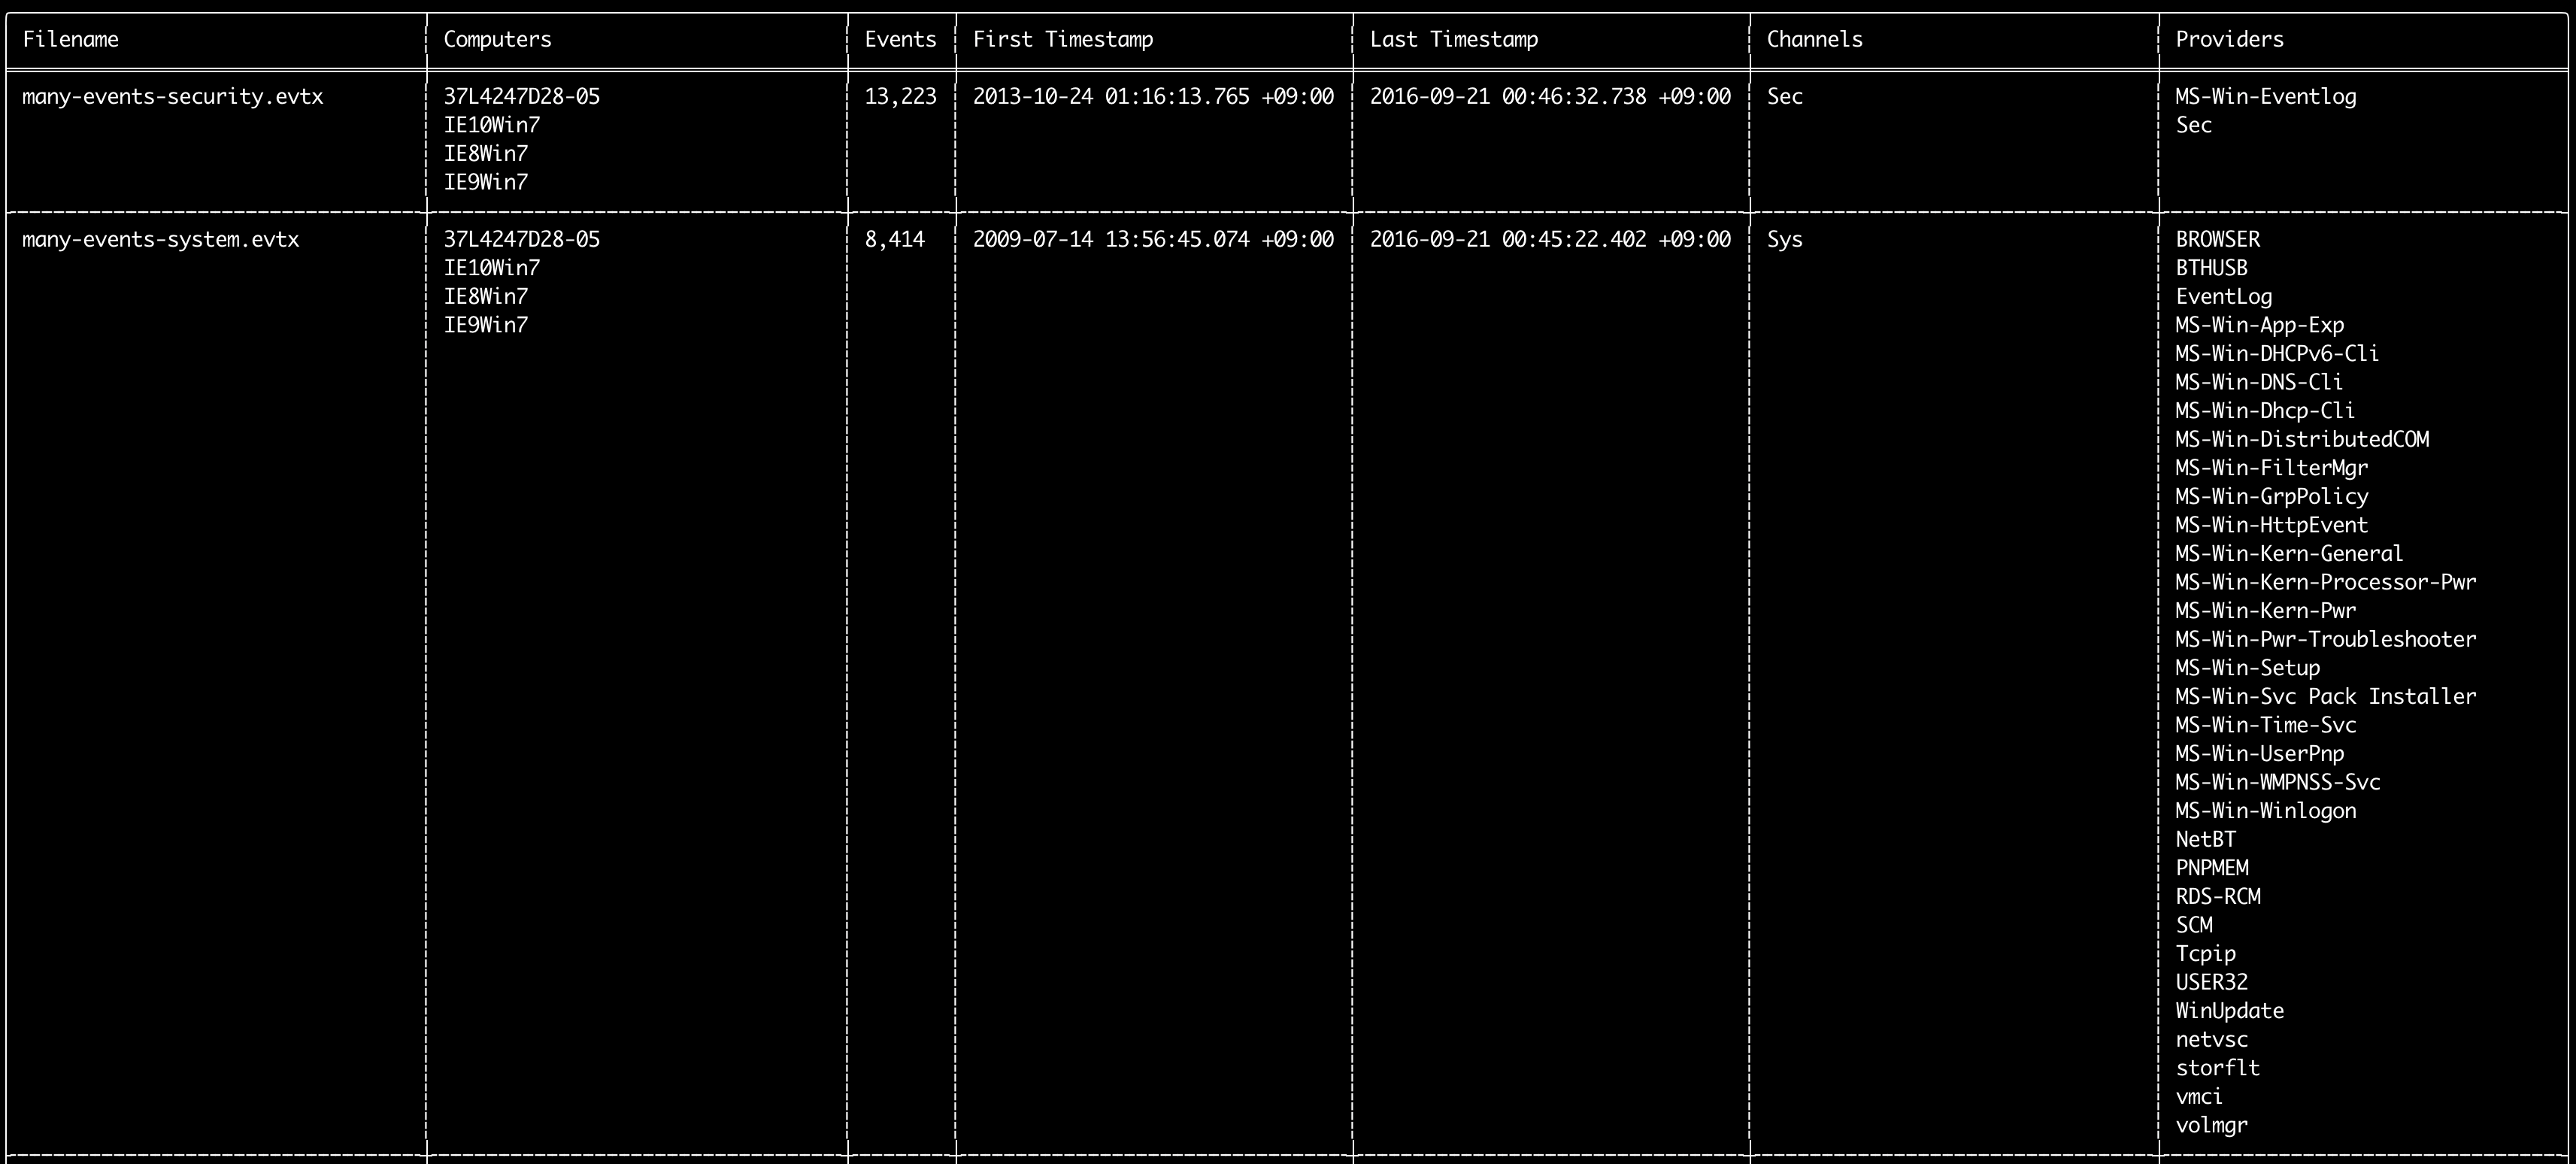
Anda dapat menggunakan perintah log-metrics untuk mencetak metadata berikut di dalam event log:
* Filename
* Computer names
* Number of events
* First timestamp
* Last timestamp
* Channels
* Providers
Perintah ini tidak menggunakan aturan deteksi apa pun sehingga akan memindai semua event.
Usage: log-metrics <INPUT> [OPTIONS]

Input:
  -d, --directory <DIR>  Directory of multiple .evtx files
  -f, --file <FILE>      File path to one .evtx file
  -l, --live-analysis    Analyze the local C:\Windows\System32\winevt\Logs folder

General Options:
  -C, --clobber                        Overwrite files when saving
  -h, --help                           Show the help menu
  -J, --JSON-input                     Scan JSON formatted logs instead of .evtx (.json or .jsonl)
  -Q, --quiet-errors                   Quiet errors mode: do not save error logs
  -x, --recover-records                Carve evtx records from slack space (default: disabled)
  -c, --rules-config <DIR>             Specify custom rule config directory (default: ./rules/config)
  -t, --threads <NUMBER>               Number of threads (default: optimal number for performance)
      --target-file-ext <FILE-EXT...>  Specify additional evtx file extensions (ex: evtx_data)

Filtering:
      --exclude-computer <COMPUTER...>  Do not scan specified computer names (ex: ComputerA) (ex: ComputerA,ComputerB)
      --include-computer <COMPUTER...>  Scan only specified computer names (ex: ComputerA) (ex: ComputerA,ComputerB)
      --time-offset <OFFSET>            Scan recent events based on an offset (ex: 1y, 3M, 30d, 24h, 30m)

Output:
  -b, --disable-abbreviations  Disable abbreviations
  -M, --multiline              Output event field information in multiple rows for CSV output
  -o, --output <FILE>          Save the Metrics in CSV format (ex: metrics.csv)
  -S, --tab-separator          Separate event field information by tabs

Display Settings:
  -K, --no-color  Disable color output
  -q, --quiet     Quiet mode: do not display the launch banner
  -v, --verbose   Output verbose information

Time Format:
      --European-time     Output timestamp in European time format (ex: 22-02-2022 22:00:00.123 +02:00)
  -O, --ISO-8601          Output timestamp in original ISO-8601 format (ex: 2022-02-22T10:10:10.1234567Z) (Always UTC)
      --RFC-2822          Output timestamp in RFC 2822 format (ex: Fri, 22 Feb 2022 22:00:00 -0600)
      --RFC-3339          Output timestamp in RFC 3339 format (ex: 2022-02-22 22:00:00.123456-06:00)
      --US-military-time  Output timestamp in US military time format (ex: 02-22-2022 22:00:00.123 -06:00)
      --US-time           Output timestamp in US time format (ex: 02-22-2022 10:00:00.123 PM -06:00)
  -U, --UTC               Output time in UTC format (default: local time)
Contoh perintah log-metrics
- Cetak metrik Event ID dari satu file:
hayabusa.exe log-metrics -f Security.evtx - Cetak metrik Event ID dari sebuah direktori:
hayabusa.exe log-metrics -d ../logs - Simpan hasil ke file CSV:
hayabusa.exe log-metrics -d ../logs -o eid-metrics.csv
Tangkapan layar log-metrics
Perintah logon-summary
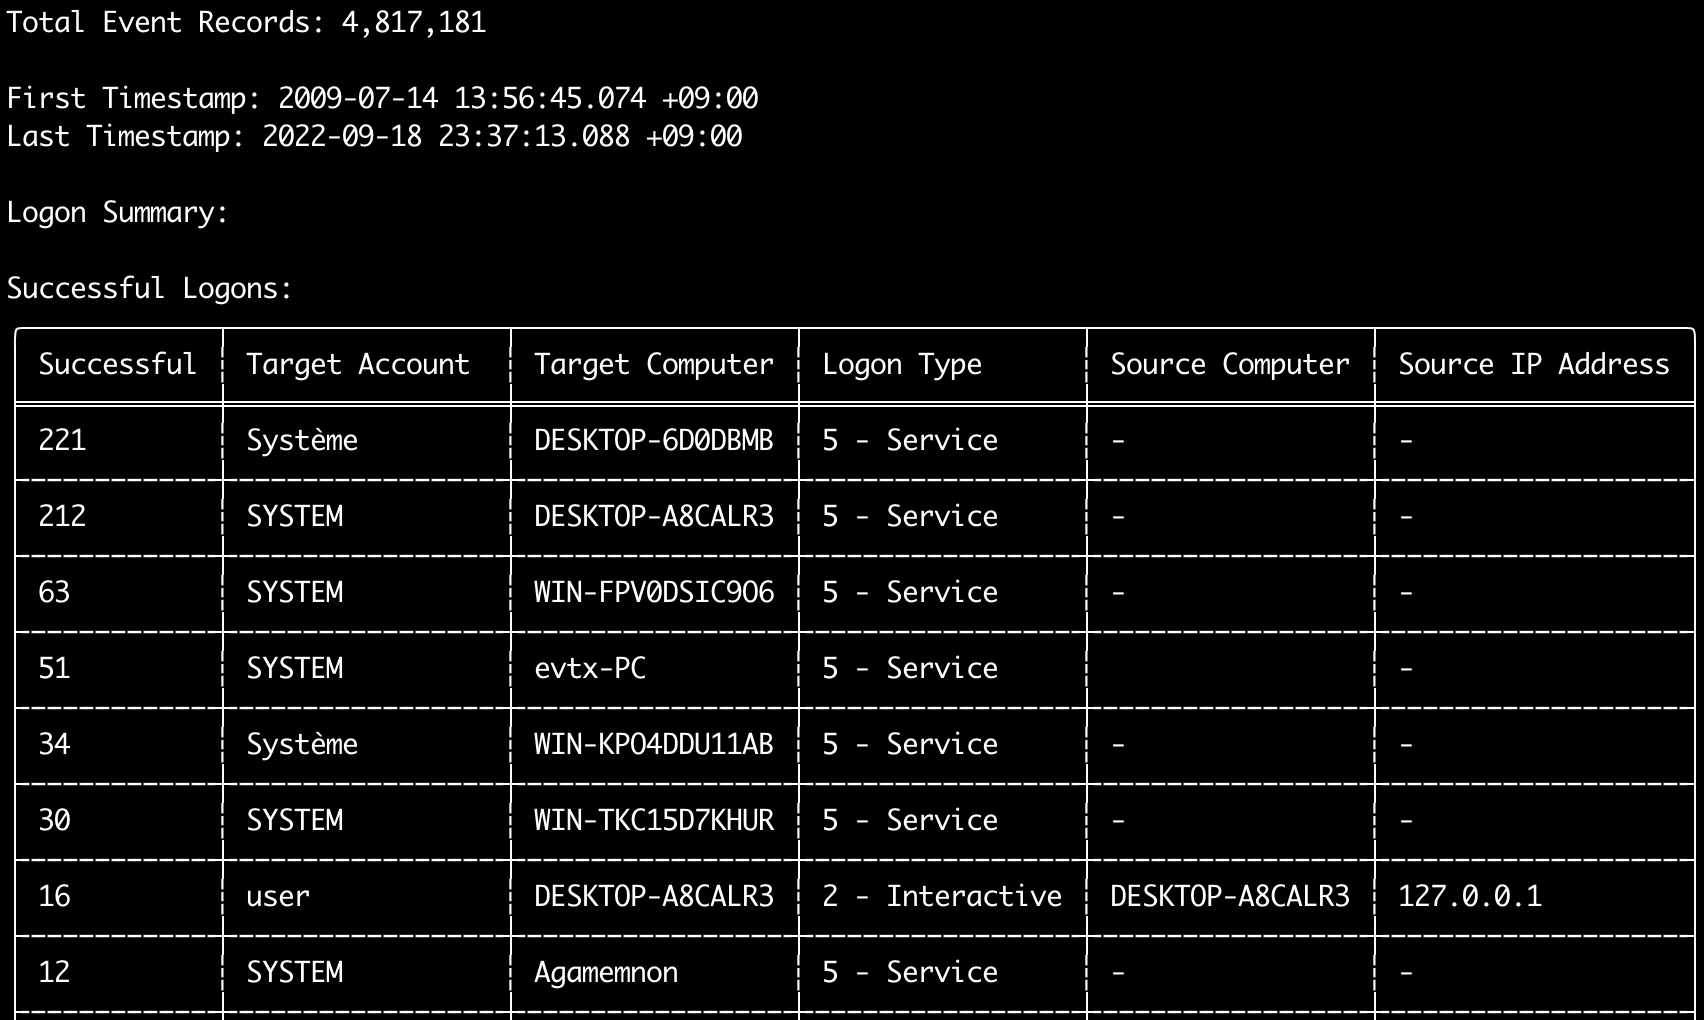
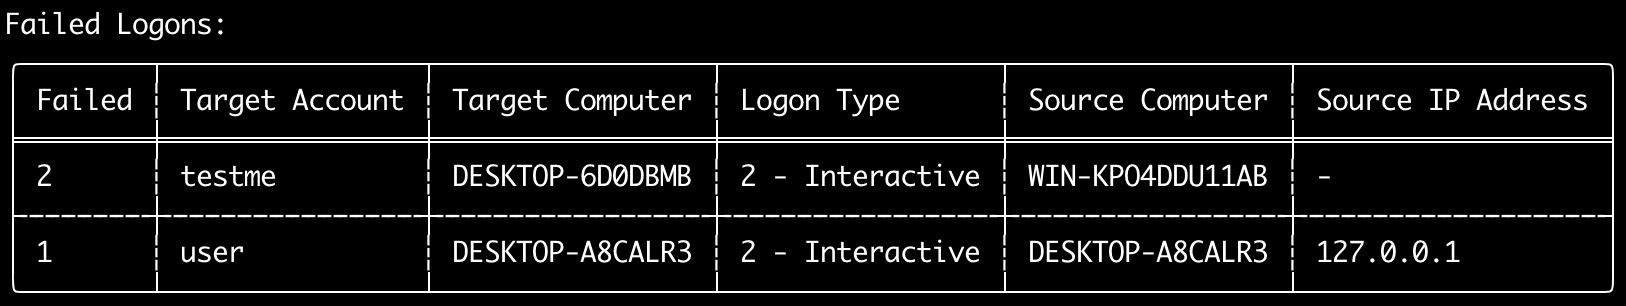
Anda dapat menggunakan perintah logon-summary untuk mengeluarkan ringkasan informasi logon (nama pengguna logon serta jumlah logon yang berhasil dan gagal).
Anda dapat menampilkan informasi logon untuk satu file evtx dengan -f atau beberapa file evtx dengan opsi -d.
Logon yang berhasil diambil dari event berikut:
* Security 4624 (Successful Logon)
* RDS-LSM 21 (Remote Desktop Service Local Session Manager Logon)
* RDS-GTW 302 (Remote Desktop Service Gateway Logon)
Logon yang gagal diambil dari event Security 4625.
Usage: logon-summary <INPUT> [OPTIONS]

Input:
  -d, --directory <DIR>  Directory of multiple .evtx files
  -f, --file <FILE>      File path to one .evtx file
  -l, --live-analysis    Analyze the local C:\Windows\System32\winevt\Logs folder

General Options:
  -C, --clobber                        Overwrite files when saving
  -h, --help                           Show the help menu
  -J, --JSON-input                     Scan JSON formatted logs instead of .evtx (.json or .jsonl)
  -Q, --quiet-errors                   Quiet errors mode: do not save error logs
  -x, --recover-records                Carve evtx records from slack space (default: disabled)
  -c, --rules-config <DIR>             Specify custom rule config directory (default: ./rules/config)
  -t, --threads <NUMBER>               Number of threads (default: optimal number for performance)
      --target-file-ext <FILE-EXT...>  Specify additional evtx file extensions (ex: evtx_data)

Filtering:
      --exclude-computer <COMPUTER...>  Do not scan specified computer names (ex: ComputerA) (ex: ComputerA,ComputerB)
      --include-computer <COMPUTER...>  Scan only specified computer names (ex: ComputerA) (ex: ComputerA,ComputerB)
      --time-offset <OFFSET>            Scan recent events based on an offset (ex: 1y, 3M, 30d, 24h, 30m)
      --timeline-end <DATE>             End time of the event logs to load (ex: "2022-02-22 23:59:59 +09:00")
      --timeline-start <DATE>           Start time of the event logs to load (ex: "2020-02-22 00:00:00 +09:00")

Output:
  -o, --output <FILENAME-PREFIX>  Save the logon summary to two CSV files (ex: -o logon-summary)

Display Settings:
  -K, --no-color  Disable color output
  -q, --quiet     Quiet mode: do not display the launch banner
  -v, --verbose   Output verbose information

Time Format:
      --European-time     Output timestamp in European time format (ex: 22-02-2022 22:00:00.123 +02:00)
  -O, --ISO-8601          Output timestamp in original ISO-8601 format (ex: 2022-02-22T10:10:10.1234567Z) (Always UTC)
      --RFC-2822          Output timestamp in RFC 2822 format (ex: Fri, 22 Feb 2022 22:00:00 -0600)
      --RFC-3339          Output timestamp in RFC 3339 format (ex: 2022-02-22 22:00:00.123456-06:00)
      --US-military-time  Output timestamp in US military time format (ex: 02-22-2022 22:00:00.123 -06:00)
      --US-time           Output timestamp in US time format (ex: 02-22-2022 10:00:00.123 PM -06:00)
  -U, --UTC               Output time in UTC format (default: local time)
Contoh perintah logon-summary
- Cetak ringkasan logon:
hayabusa.exe logon-summary -f Security.evtx - Simpan hasil ringkasan logon:
hayabusa.exe logon-summary -d ../logs -o logon-summary.csv
Tangkapan layar logon-summary
Perintah pivot-keywords-list
Anda dapat menggunakan perintah pivot-keywords-list untuk membuat daftar kata kunci pivot unik untuk dengan cepat mengidentifikasi pengguna, hostname, proses, dll. yang abnormal serta mengorelasikan event.
Penting: secara default, hayabusa akan mengembalikan hasil dari semua event (informational dan lebih tinggi) sehingga kami sangat menyarankan untuk menggabungkan perintah pivot-keywords-list dengan opsi -m, --min-level.
Misalnya, mulai dengan hanya membuat kata kunci dari alert critical dengan -m critical lalu lanjutkan dengan -m high, -m medium, dll.
Kemungkinan besar akan ada kata kunci umum dalam hasil Anda yang akan cocok pada banyak event normal, jadi setelah memeriksa hasil secara manual dan membuat daftar kata kunci unik dalam satu file, Anda kemudian dapat membuat timeline aktivitas mencurigakan yang dipersempit dengan perintah seperti grep -f keywords.txt timeline.csv.
Usage: pivot-keywords-list <INPUT> [OPTIONS]

Input:
  -d, --directory <DIR>  Directory of multiple .evtx files
  -f, --file <FILE>      File path to one .evtx file
  -l, --live-analysis    Analyze the local C:\Windows\System32\winevt\Logs folder

General Options:
  -C, --clobber                        Overwrite files when saving
  -h, --help                           Show the help menu
  -J, --JSON-input                     Scan JSON formatted logs instead of .evtx (.json or .jsonl)
  -w, --no-wizard                      Do not ask questions. Scan for all events and alerts
  -Q, --quiet-errors                   Quiet errors mode: do not save error logs
  -x, --recover-records                Carve evtx records from slack space (default: disabled)
  -c, --rules-config <DIR>             Specify custom rule config directory (default: ./rules/config)
  -t, --threads <NUMBER>               Number of threads (default: optimal number for performance)
      --target-file-ext <FILE-EXT...>  Specify additional evtx file extensions (ex: evtx_data)

Filtering:
  -E, --EID-filter                      Scan only common EIDs for faster speed (./rules/config/target_event_IDs.txt)
  -D, --enable-deprecated-rules         Enable rules with a status of deprecated
  -n, --enable-noisy-rules              Enable rules set to noisy (./rules/config/noisy_rules.txt)
  -u, --enable-unsupported-rules        Enable rules with a status of unsupported
  -e, --exact-level <LEVEL>             Only load rules with a specific level (informational, low, medium, high, critical)
      --exclude-computer <COMPUTER...>  Do not scan specified computer names (ex: ComputerA) (ex: ComputerA,ComputerB)
      --exclude-eid <EID...>            Do not scan specific EIDs for faster speed (ex: 1) (ex: 1,4688)
      --exclude-status <STATUS...>      Do not load rules according to status (ex: experimental) (ex: stable,test)
      --exclude-tag <TAG...>            Do not load rules with specific tags (ex: sysmon)
      --include-computer <COMPUTER...>  Scan only specified computer names (ex: ComputerA) (ex: ComputerA,ComputerB)
      --include-eid <EID...>            Scan only specified EIDs for faster speed (ex: 1) (ex: 1,4688)
      --include-status <STATUS...>      Only load rules with specific status (ex: experimental) (ex: stable,test)
      --include-tag <TAG...>            Only load rules with specific tags (ex: attack.execution,attack.discovery)
  -m, --min-level <LEVEL>               Minimum level for rules to load (default: informational)
      --time-offset <OFFSET>            Scan recent events based on an offset (ex: 1y, 3M, 30d, 24h, 30m)
      --timeline-end <DATE>             End time of the event logs to load (ex: "2022-02-22 23:59:59 +09:00")
      --timeline-start <DATE>           Start time of the event logs to load (ex: "2020-02-22 00:00:00 +09:00")

Output:
  -o, --output <FILENAME-PREFIX>  Save pivot words to separate files (ex: PivotKeywords)

Display Settings:
  -K, --no-color  Disable color output
  -q, --quiet     Quiet mode: do not display the launch banner
  -v, --verbose   Output verbose information
Contoh perintah pivot-keywords-list
- Keluarkan kata kunci pivot ke layar:
hayabusa.exe pivot-keywords-list -d ../logs -m critical - Buat daftar kata kunci pivot dari alert critical dan simpan hasilnya. (Hasil akan disimpan ke
keywords-Ip Addresses.txt,keywords-Users.txt, dll.):
File konfigurasi pivot-keywords-list
Anda dapat menyesuaikan kata kunci apa yang ingin Anda cari dengan mengedit ./rules/config/pivot_keywords.txt.
Halaman ini adalah pengaturan default.
Formatnya adalah KeywordName.FieldName. Misalnya, saat membuat daftar Users, hayabusa akan mendaftar semua nilai dalam field SubjectUserName, TargetUserName, dan User.
Perintah search
Perintah search memungkinkan Anda melakukan pencarian kata kunci pada semua event.
(Tidak hanya hasil deteksi Hayabusa.)
Ini berguna untuk menentukan apakah ada bukti dalam event yang tidak terdeteksi oleh Hayabusa.
Usage: hayabusa.exe search <INPUT> <--keywords "<KEYWORDS>" OR --regex "<REGEX>"> [OPTIONS]

Display Settings:
  -K, --no-color  Disable color output
  -q, --quiet     Quiet mode: do not display the launch banner
  -v, --verbose   Output verbose information

General Options:
  -C, --clobber                        Overwrite files when saving
  -h, --help                           Show the help menu
  -Q, --quiet-errors                   Quiet errors mode: do not save error logs
  -x, --recover-records                Carve evtx records from slack space (default: disabled)
  -c, --rules-config <DIR>             Specify custom rule config directory (default: ./rules/config)
  -t, --threads <NUMBER>               Number of threads (default: optimal number for performance)
      --target-file-ext <FILE-EXT...>  Specify additional evtx file extensions (ex: evtx_data)
  -s, --sort                           Sort results before saving the file (warning: this uses much more memory!)

Input:
  -d, --directory <DIR>  Directory of multiple .evtx files
  -f, --file <FILE>      File path to one .evtx file
  -l, --live-analysis    Analyze the local C:\Windows\System32\winevt\Logs folder

Filtering:
  -a, --and-logic              Search keywords with AND logic (default: OR)
  -F, --filter <FILTER...>     Filter by specific field(s)
  -i, --ignore-case            Case-insensitive keyword search
  -k, --keyword <KEYWORD...>   Search by keyword(s)
  -r, --regex <REGEX>          Search by regular expression
      --time-offset <OFFSET>   Scan recent events based on an offset (ex: 1y, 3M, 30d, 24h, 30m)
      --timeline-end <DATE>    End time of the event logs to load (ex: "2022-02-22 23:59:59 +09:00")
      --timeline-start <DATE>  Start time of the event logs to load (ex: "2020-02-22 00:00:00 +09:00")

Output:
  -b, --disable-abbreviations  Disable abbreviations
  -J, --JSON-output            Save the search results in JSON format (ex: -J -o results.json)
  -L, --JSONL-output           Save the search results in JSONL format (ex: -L -o results.jsonl)
  -M, --multiline              Output event field information in multiple rows for CSV output
  -o, --output <FILE>          Save the search results in CSV format (ex: search.csv)
  -S, --tab-separator          Separate event field information by tabs

Time Format:
      --European-time     Output timestamp in European time format (ex: 22-02-2022 22:00:00.123 +02:00)
  -O, --ISO-8601          Output timestamp in original ISO-8601 format (ex: 2022-02-22T10:10:10.1234567Z) (Always UTC)
      --RFC-2822          Output timestamp in RFC 2822 format (ex: Fri, 22 Feb 2022 22:00:00 -0600)
      --RFC-3339          Output timestamp in RFC 3339 format (ex: 2022-02-22 22:00:00.123456-06:00)
      --US-military-time  Output timestamp in US military time format (ex: 02-22-2022 22:00:00.123 -06:00)
      --US-time           Output timestamp in US time format (ex: 02-22-2022 10:00:00.123 PM -06:00)
  -U, --UTC               Output time in UTC format (default: local time)
Contoh perintah search
- Cari kata kunci
mimikatzdi direktori../hayabusa-sample-evtx:
Catatan: Kata kunci akan cocok jika
mimikatzditemukan di mana saja dalam data. Ini bukan pencocokan tepat.
- Cari kata kunci
mimikatzataukalidi direktori../hayabusa-sample-evtx:
- Cari kata kunci
mimikatzdi direktori../hayabusa-sample-evtxdan abaikan huruf besar/kecil:
- Cari alamat IP di direktori
../hayabusa-sample-evtxmenggunakan ekspresi reguler:
- Cari di direktori
../hayabusa-sample-evtxdan tampilkan semua event di mana fieldWorkstationNameadalahkali:
Catatan:
.*adalah ekspresi reguler untuk mencocokkan setiap event.
File konfigurasi perintah search
./rules/config/channel_abbreviations.txt: Pemetaan nama channel dan singkatannya.