ဆန်းစစ်ခြင်း Commands
computer-metrics command
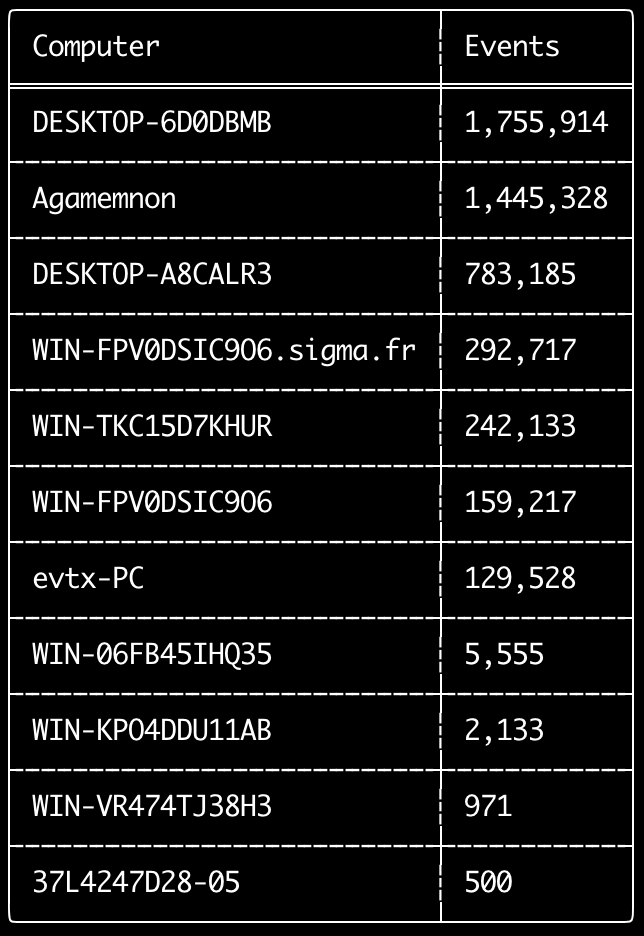
<System><Computer> field တွင် သတ်မှတ်ထားသော ကွန်ပျူတာတစ်ခုစီအလိုက် event မည်မျှရှိသည်ကို စစ်ဆေးရန် computer-metrics command ကို အသုံးပြုနိုင်ပါသည်။
Event များကို ၎င်းတို့၏ မူရင်းကွန်ပျူတာအလိုက် ခွဲခြားရာတွင် Computer field ကို လုံးဝ အားကိုးမရနိုင်ကြောင်း သတိပြုပါ။
Windows 11 သည် event log များသို့ သိမ်းဆည်းရာတွင် တစ်ခါတစ်ရံ လုံးဝ မတူညီသော Computer အမည်များကို အသုံးပြုတတ်ပါသည်။
ထို့အပြင် Windows 10 သည် တစ်ခါတစ်ရံ Computer အမည်ကို အက္ခရာအသေးများဖြင့်သာ မှတ်တမ်းတင်တတ်ပါသည်။
ဤ command သည် detection rule မည်သည့်တစ်ခုကိုမျှ အသုံးမပြုသဖြင့် event အားလုံးကို ဆန်းစစ်ပါမည်။
မည်သည့်ကွန်ပျူတာများတွင် log အများဆုံးရှိသည်ကို လျင်မြန်စွာ ကြည့်ရှုရန် ဤ command သည် အသုံးဝင်ပါသည်။
ဤအချက်အလက်များဖြင့် သင်၏ timeline များ ဖန်တီးသည့်အခါ --include-computer သို့မဟုတ် --exclude-computer option များကို အသုံးပြုနိုင်ပြီး ကွန်ပျူတာအလိုက် timeline အများအပြားကို ဖန်တီးခြင်း သို့မဟုတ် အချို့ကွန်ပျူတာများမှ event များကို ဖယ်ထုတ်ခြင်းဖြင့် သင်၏ timeline ဖန်တီးမှုကို ပိုမိုထိရောက်စေနိုင်ပါသည်။
Usage: computer-metrics <INPUT> [OPTIONS]

Input:
  -d, --directory <DIR>  Directory of multiple .evtx files
  -f, --file <FILE>      File path to one .evtx file
  -l, --live-analysis    Analyze the local C:\Windows\System32\winevt\Logs folder

General Options:
  -C, --clobber                        Overwrite files when saving
  -h, --help                           Show the help menu
  -J, --JSON-input                     Scan JSON formatted logs instead of .evtx (.json or .jsonl)
  -Q, --quiet-errors                   Quiet errors mode: do not save error logs
  -x, --recover-records                Carve evtx records from slack space (default: disabled)
  -c, --rules-config <DIR>             Specify custom rule config directory (default: ./rules/config)
      --target-file-ext <FILE-EXT...>  Specify additional evtx file extensions (ex: evtx_data)
  -t, --threads <NUMBER>               Number of threads (default: optimal number for performance)

Filtering:
      --time-offset <OFFSET>  Scan recent events based on an offset (ex: 1y, 3M, 30d, 24h, 30m)

Output:
  -o, --output <FILE>  Save the results in CSV format (ex: computer-metrics.csv)

Display Settings:
  -K, --no-color  Disable color output
  -q, --quiet     Quiet mode: do not display the launch banner
  -v, --verbose   Output verbose information
computer-metrics command ဥပမာများ
- directory တစ်ခုမှ ကွန်ပျူတာအမည် metrics များကို print ထုတ်ရန်:
hayabusa.exe computer-metrics -d ../logs - ရလဒ်များကို CSV file တစ်ခုသို့ သိမ်းဆည်းရန်:
hayabusa.exe computer-metrics -d ../logs -o computer-metrics.csv
computer-metrics screenshot
eid-metrics command
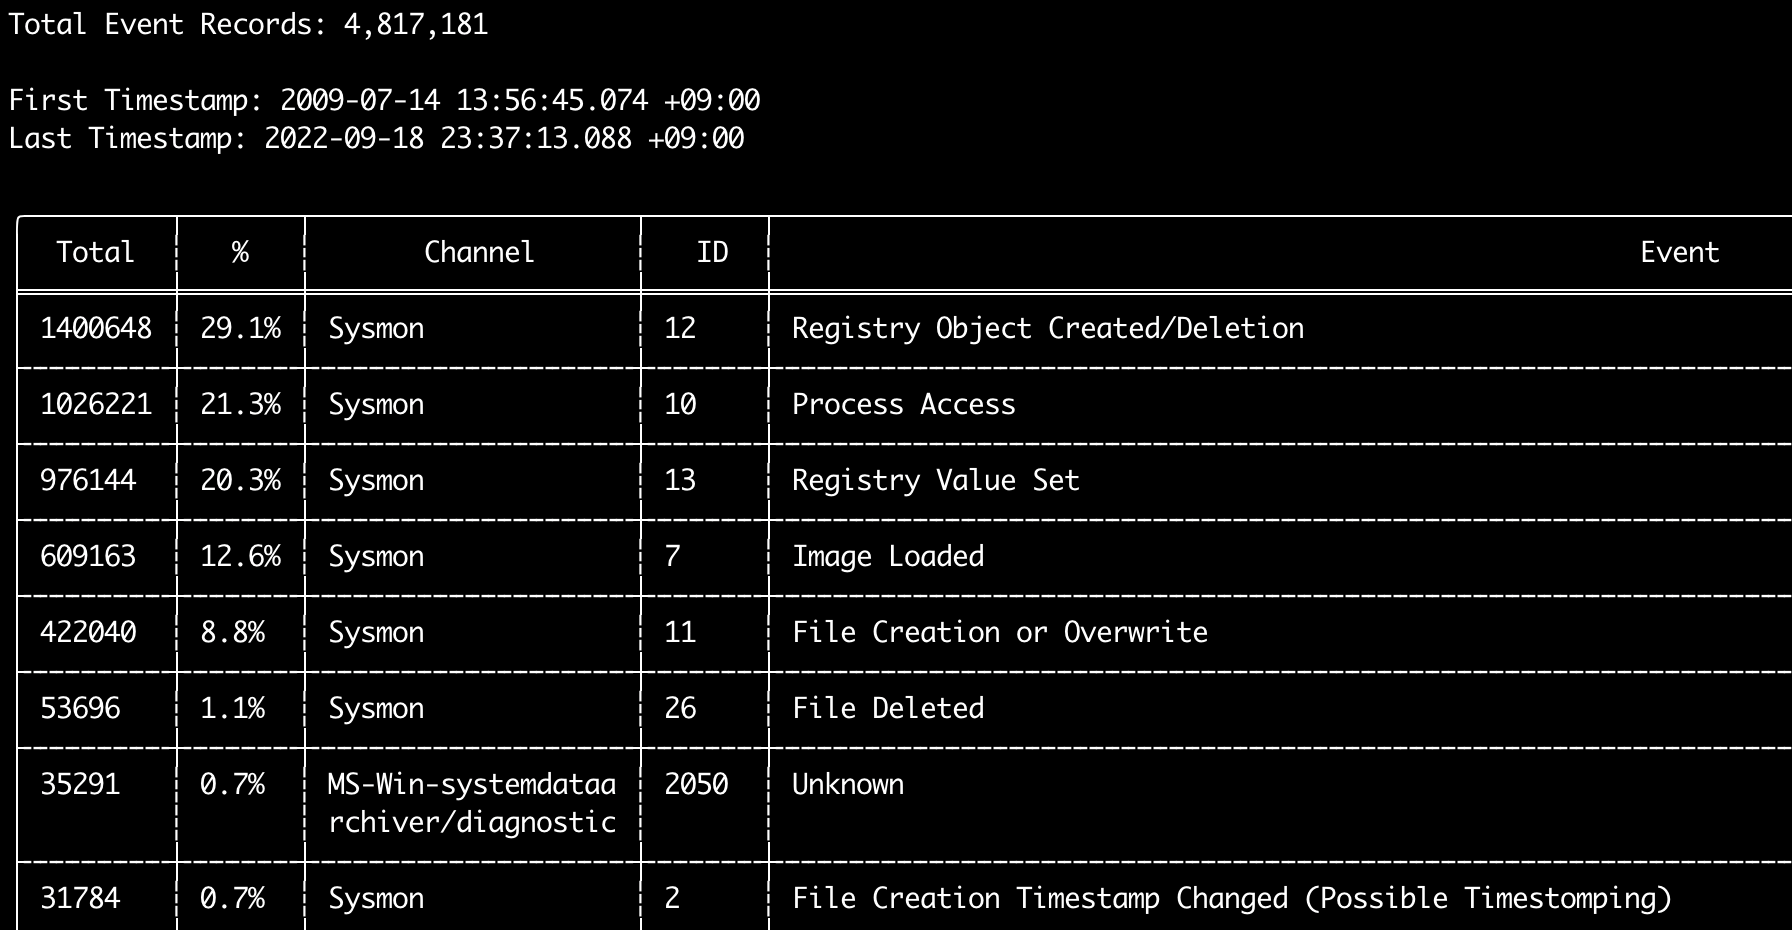
channel အလိုက် ခွဲခြားထားသော event ID (<System><EventID> field) များ၏ စုစုပေါင်းအရေအတွက်နှင့် ရာခိုင်နှုန်းကို print ထုတ်ရန် eid-metrics command ကို အသုံးပြုနိုင်ပါသည်။
ဤ command သည် detection rule မည်သည့်တစ်ခုကိုမျှ အသုံးမပြုသဖြင့် event အားလုံးကို scan ဖတ်ပါမည်။
Usage: eid-metrics <INPUT> [OPTIONS]

Input:
  -d, --directory <DIR>  Directory of multiple .evtx files
  -f, --file <FILE>      File path to one .evtx file
  -l, --live-analysis    Analyze the local C:\Windows\System32\winevt\Logs folder

General Options:
  -C, --clobber                        Overwrite files when saving
  -h, --help                           Show the help menu
  -J, --JSON-input                     Scan JSON formatted logs instead of .evtx (.json or .jsonl)
  -Q, --quiet-errors                   Quiet errors mode: do not save error logs
  -x, --recover-records                Carve evtx records from slack space (default: disabled)
  -c, --rules-config <DIR>             Specify custom rule config directory (default: ./rules/config)
  -t, --threads <NUMBER>               Number of threads (default: optimal number for performance)
      --target-file-ext <FILE-EXT...>  Specify additional evtx file extensions (ex: evtx_data)

Filtering:
      --exclude-computer <COMPUTER...>  Do not scan specified computer names (ex: ComputerA) (ex: ComputerA,ComputerB)
      --include-computer <COMPUTER...>  Scan only specified computer names (ex: ComputerA) (ex: ComputerA,ComputerB)
      --time-offset <OFFSET>            Scan recent events based on an offset (ex: 1y, 3M, 30d, 24h, 30m)

Output:
  -b, --disable-abbreviations  Disable abbreviations
  -o, --output <FILE>          Save the Metrics in CSV format (ex: metrics.csv)

Display Settings:
  -K, --no-color  Disable color output
  -q, --quiet     Quiet mode: do not display the launch banner
  -v, --verbose   Output verbose information

Time Format:
      --European-time     Output timestamp in European time format (ex: 22-02-2022 22:00:00.123 +02:00)
  -O, --ISO-8601          Output timestamp in original ISO-8601 format (ex: 2022-02-22T10:10:10.1234567Z) (Always UTC)
      --RFC-2822          Output timestamp in RFC 2822 format (ex: Fri, 22 Feb 2022 22:00:00 -0600)
      --RFC-3339          Output timestamp in RFC 3339 format (ex: 2022-02-22 22:00:00.123456-06:00)
      --US-military-time  Output timestamp in US military time format (ex: 02-22-2022 22:00:00.123 -06:00)
      --US-time           Output timestamp in US time format (ex: 02-22-2022 10:00:00.123 PM -06:00)
  -U, --UTC               Output time in UTC format (default: local time)
eid-metrics command ဥပမာများ
- file တစ်ခုတည်းမှ Event ID metrics များကို print ထုတ်ရန်:
hayabusa.exe eid-metrics -f Security.evtx - directory တစ်ခုမှ Event ID metrics များကို print ထုတ်ရန်:
hayabusa.exe eid-metrics -d ../logs - ရလဒ်များကို CSV file တစ်ခုသို့ သိမ်းဆည်းရန်:
hayabusa.exe eid-metrics -f Security.evtx -o eid-metrics.csv
eid-metrics command config file
event များ၏ channel, event ID များနှင့် title များကို rules/config/channel_eid_info.txt တွင် သတ်မှတ်ထားပါသည်။
ဥပမာ:
Channel,EventID,EventTitle
Microsoft-Windows-Sysmon/Operational,1,Process Creation.
Microsoft-Windows-Sysmon/Operational,2,File Creation Timestamp Changed. (Possible Timestomping)
Microsoft-Windows-Sysmon/Operational,3,Network Connection.
Microsoft-Windows-Sysmon/Operational,4,Sysmon Service State Changed.
eid-metrics screenshot
expand-list command
rules folder မှ expand placeholder များကို ထုတ်ယူပါ။
ဤအချက်သည် expand field modifier ကို အသုံးပြုသော rule တစ်ခုခုကို အသုံးပြုရန် config file များ ဖန်တီးရာတွင် အသုံးဝင်ပါသည်။
expand rule များကို အသုံးပြုရန်အတွက် ./config/expand/ directory အောက်တွင် expand field modifier ၏ အမည်ဖြင့် .txt file တစ်ခုကို ဖန်တီးပြီး၊ စစ်ဆေးလိုသော တန်ဖိုးအားလုံးကို ၎င်း file အတွင်းတွင် ထည့်သွင်းရုံသာ လိုအပ်ပါသည်။
ဥပမာအားဖြင့်၊ rule ၏ detection logic မှာ:
detection:
    selection:
        EventID: 5145
        RelativeTargetName|contains: '\winreg'
    filter_main:
        IpAddress|expand: '%Admins_Workstations%'
    condition: selection and not filter_main
ဆိုပါက သင်သည် text file ./config/expand/Admins_Workstations.txt ကို ဖန်တီးပြီး အောက်ပါကဲ့သို့ တန်ဖိုးများကို ထည့်သွင်းရပါမည်:
ဤသည်မှာ အခြေခံအားဖြင့် အောက်ပါ logic နှင့် တူညီစွာ စစ်ဆေးပေးပါမည်:
config file မရှိပါက Hayabusa သည် expand rule ကို ဆက်လက် load လုပ်မည်ဖြစ်သော်လည်း ၎င်းကို လျစ်လျူရှုပါမည်။
Usage:  expand-list <INPUT> [OPTIONS]

General Options:
  -h, --help              Show the help menu
  -r, --rules <DIR/FILE>  Specify rule directory (default: ./rules)

Display Settings:
  -K, --no-color  Disable color output
  -q, --quiet     Quiet mode: do not display the launch banner
expand-list command ဥပမာများ
- default
rulesdirectory မှexpandfield modifier များကို ထုတ်ယူရန်:hayabusa.exe expand-list sigmadirectory မှexpandfield modifier များကို ထုတ်ယူရန်:hayabusa.exe eid-metrics -r ../sigma
expand-list ရလဒ်များ
5 unique expand placeholders found:
Admins_Workstations
DC-MACHINE-NAME
Workstations
internal_domains
domain_controller_hostnames
extract-base64 command
ဤ command သည် အောက်ပါ event များမှ base64 string များကို ထုတ်ယူ၍ decode လုပ်ပြီး မည်သည့် encoding အမျိုးအစားကို အသုံးပြုနေသည်ကို ပြောပြပေးပါမည်။ * Security 4688 CommandLine * Sysmon 1 CommandLine, ParentCommandLine * System 7045 ImagePath * PowerShell Operational 4104 * PowerShell Operational 4103
Usage:  extract-base64 <INPUT> [OPTIONS]

Input:
  -d, --directory <DIR>  Directory of multiple .evtx files
  -f, --file <FILE>      File path to one .evtx file
  -l, --live-analysis    Analyze the local C:\Windows\System32\winevt\Logs folder

General Options:
  -C, --clobber                        Overwrite files when saving
  -h, --help                           Show the help menu
  -J, --JSON-input                     Scan JSON formatted logs instead of .evtx (.json or .jsonl)
  -Q, --quiet-errors                   Quiet errors mode: do not save error logs
  -x, --recover-records                Carve evtx records from slack space (default: disabled)
  -c, --rules-config <DIR>             Specify custom rule config directory (default: ./rules/config)
  -t, --threads <NUMBER>               Number of threads (default: optimal number for performance)
      --target-file-ext <FILE-EXT...>  Specify additional evtx file extensions (ex: evtx_data)

Filtering:
      --exclude-computer <COMPUTER...>  Do not scan specified computer names (ex: ComputerA) (ex: ComputerA,ComputerB)
      --include-computer <COMPUTER...>  Scan only specified computer names (ex: ComputerA) (ex: ComputerA,ComputerB)
      --time-offset <OFFSET>            Scan recent events based on an offset (ex: 1y, 3M, 30d, 24h, 30m)

Output:
  -o, --output <FILE>  Extract Base64 strings

Display Settings:
  -K, --no-color  Disable color output
  -q, --quiet     Quiet mode: do not display the launch banner
  -v, --verbose   Output verbose information

Time Format:
      --European-time     Output timestamp in European time format (ex: 22-02-2022 22:00:00.123 +02:00)
  -O, --ISO-8601          Output timestamp in original ISO-8601 format (ex: 2022-02-22T10:10:10.1234567Z) (Always UTC)
      --RFC-2822          Output timestamp in RFC 2822 format (ex: Fri, 22 Feb 2022 22:00:00 -0600)
      --RFC-3339          Output timestamp in RFC 3339 format (ex: 2022-02-22 22:00:00.123456-06:00)
      --US-military-time  Output timestamp in US military time format (ex: 02-22-2022 22:00:00.123 -06:00)
      --US-time           Output timestamp in US time format (ex: 02-22-2022 10:00:00.123 PM -06:00)
  -U, --UTC               Output time in UTC format (default: local time)
extract-base64 command ဥပမာများ
- directory တစ်ခုကို scan ဖတ်၍ terminal သို့ output ထုတ်ရန်:
hayabusa.exe extract-base64 -d ../hayabusa-sample-evtx - directory တစ်ခုကို scan ဖတ်၍ CSV file တစ်ခုသို့ output ထုတ်ရန်:
hayabusa.exe eid-metrics -r ../sigma -o base64-extracted.csv
extract-base64 ရလဒ်များ
terminal သို့ output ထုတ်သည့်အခါ နေရာအကန့်အသတ်ရှိသောကြောင့် အောက်ပါ field များကိုသာ ပြသပါသည်: * Timestamp * Computer * Base64 String * Decoded String (if not binary)
CSV file တစ်ခုသို့ သိမ်းဆည်းသည့်အခါ အောက်ပါ field များကို သိမ်းဆည်းပါသည်:
* Timestamp
* Computer
* Base64 String
* Decoded String (if not binary)
* Original Field
* Length
* Binary (Y/N)
* Double Encoding (when Y, it usually is malicious)
* Encoding Type
* File Type
* Event
* Record ID
* File Name
log-metrics command
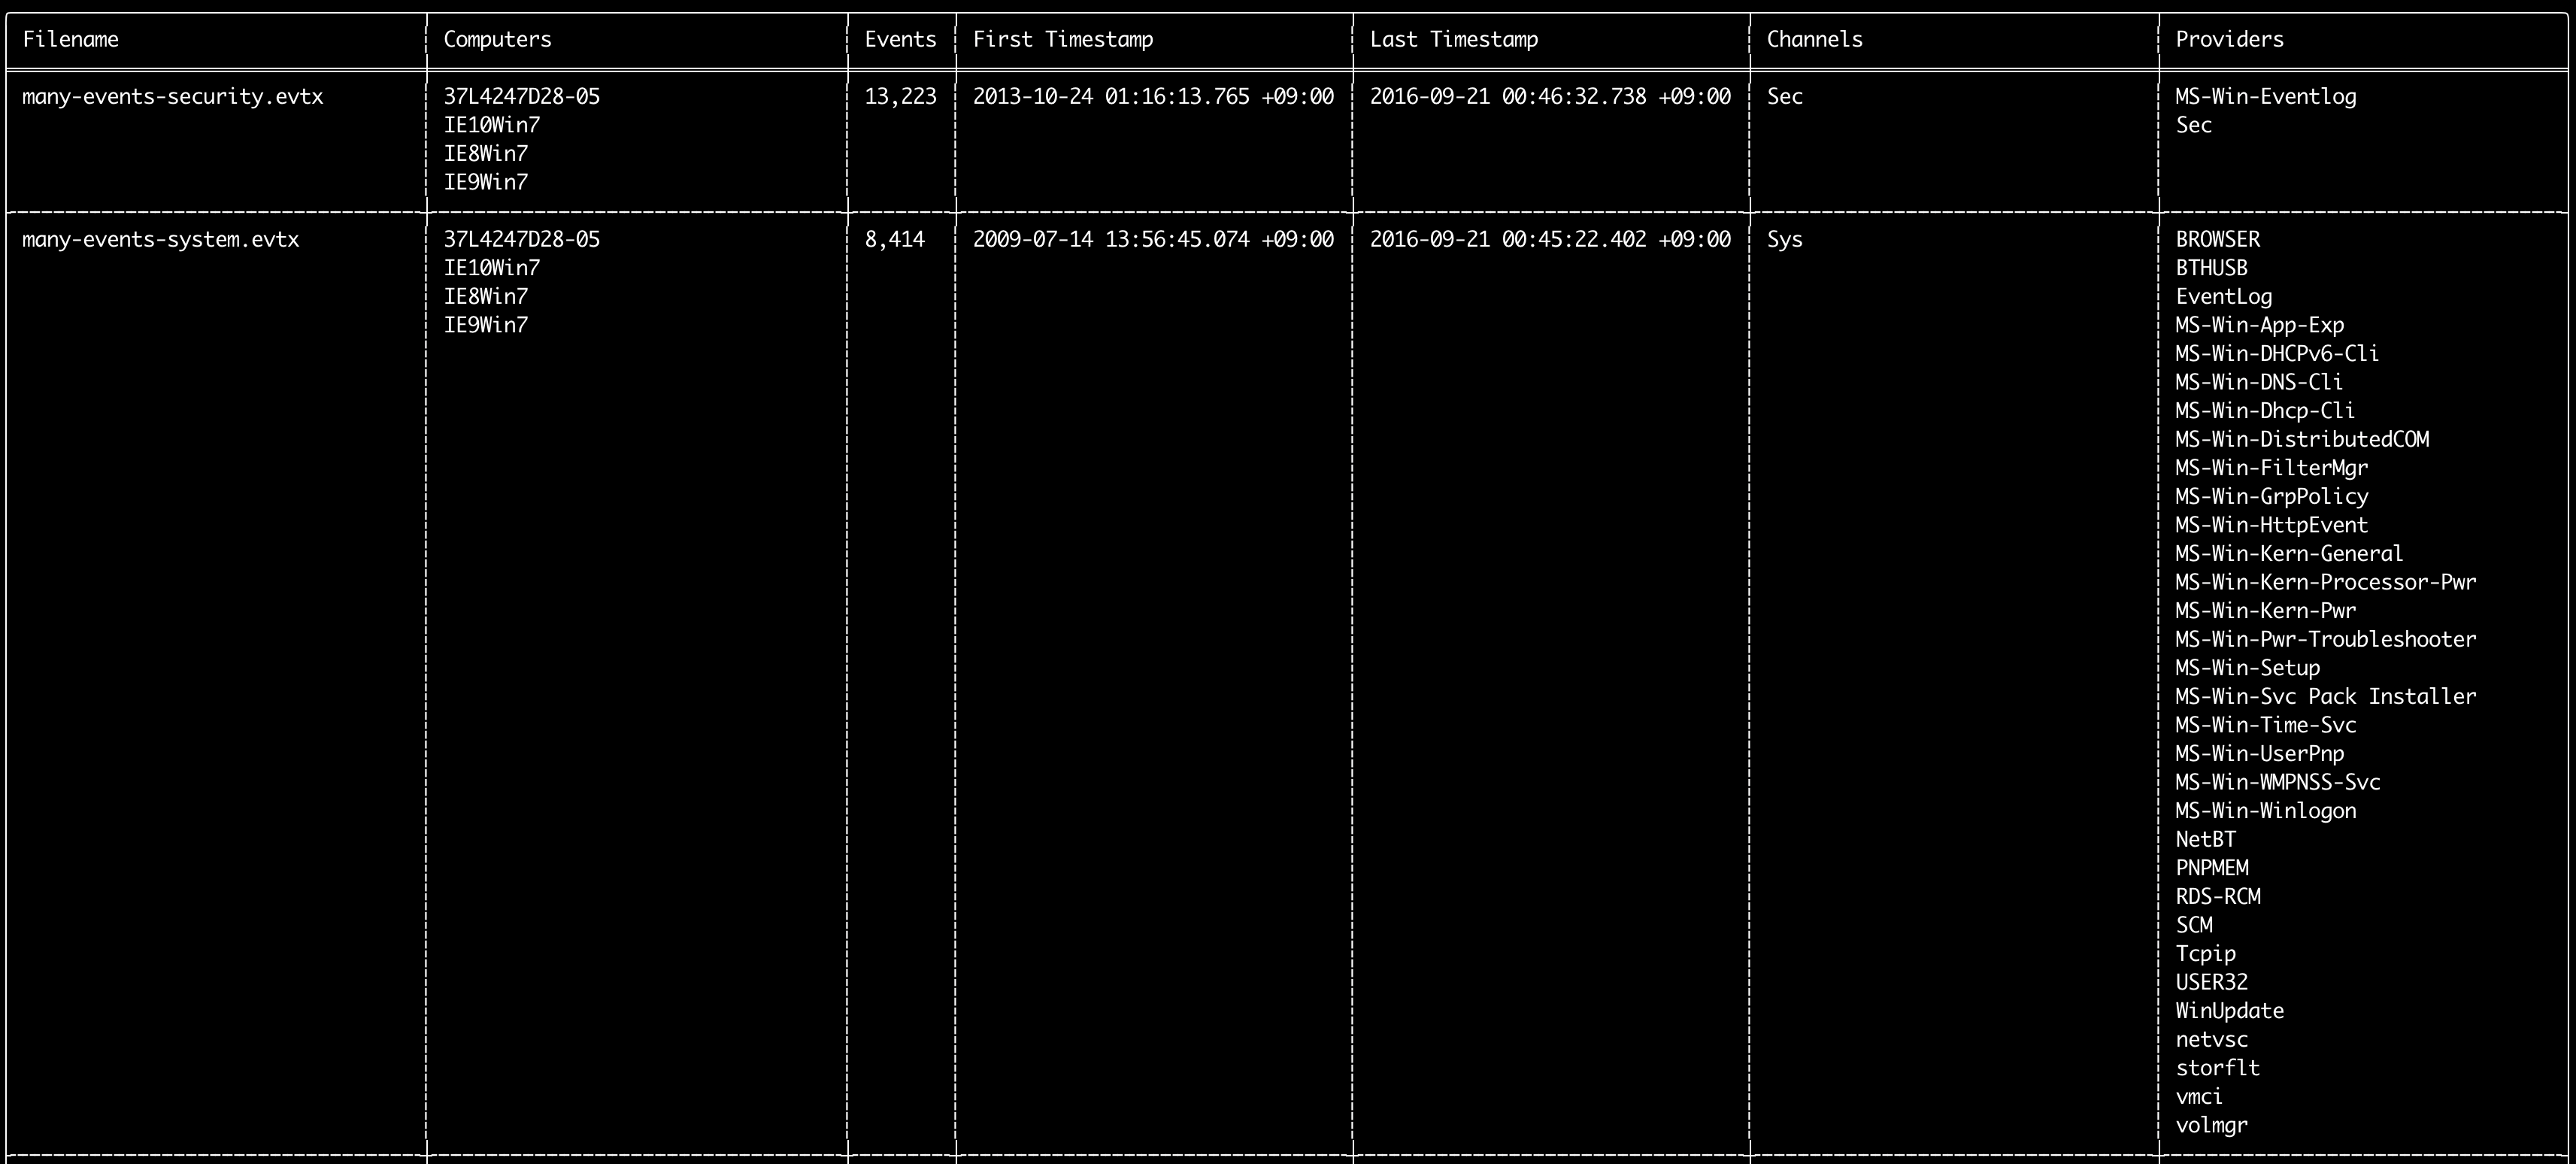
event log များအတွင်းရှိ အောက်ပါ metadata များကို print ထုတ်ရန် log-metrics command ကို အသုံးပြုနိုင်ပါသည်:
* Filename
* Computer names
* Number of events
* First timestamp
* Last timestamp
* Channels
* Providers
ဤ command သည် detection rule မည်သည့်တစ်ခုကိုမျှ အသုံးမပြုသဖြင့် event အားလုံးကို scan ဖတ်ပါမည်။
Usage: log-metrics <INPUT> [OPTIONS]

Input:
  -d, --directory <DIR>  Directory of multiple .evtx files
  -f, --file <FILE>      File path to one .evtx file
  -l, --live-analysis    Analyze the local C:\Windows\System32\winevt\Logs folder

General Options:
  -C, --clobber                        Overwrite files when saving
  -h, --help                           Show the help menu
  -J, --JSON-input                     Scan JSON formatted logs instead of .evtx (.json or .jsonl)
  -Q, --quiet-errors                   Quiet errors mode: do not save error logs
  -x, --recover-records                Carve evtx records from slack space (default: disabled)
  -c, --rules-config <DIR>             Specify custom rule config directory (default: ./rules/config)
  -t, --threads <NUMBER>               Number of threads (default: optimal number for performance)
      --target-file-ext <FILE-EXT...>  Specify additional evtx file extensions (ex: evtx_data)

Filtering:
      --exclude-computer <COMPUTER...>  Do not scan specified computer names (ex: ComputerA) (ex: ComputerA,ComputerB)
      --include-computer <COMPUTER...>  Scan only specified computer names (ex: ComputerA) (ex: ComputerA,ComputerB)
      --time-offset <OFFSET>            Scan recent events based on an offset (ex: 1y, 3M, 30d, 24h, 30m)

Output:
  -b, --disable-abbreviations  Disable abbreviations
  -M, --multiline              Output event field information in multiple rows for CSV output
  -o, --output <FILE>          Save the Metrics in CSV format (ex: metrics.csv)
  -S, --tab-separator          Separate event field information by tabs

Display Settings:
  -K, --no-color  Disable color output
  -q, --quiet     Quiet mode: do not display the launch banner
  -v, --verbose   Output verbose information

Time Format:
      --European-time     Output timestamp in European time format (ex: 22-02-2022 22:00:00.123 +02:00)
  -O, --ISO-8601          Output timestamp in original ISO-8601 format (ex: 2022-02-22T10:10:10.1234567Z) (Always UTC)
      --RFC-2822          Output timestamp in RFC 2822 format (ex: Fri, 22 Feb 2022 22:00:00 -0600)
      --RFC-3339          Output timestamp in RFC 3339 format (ex: 2022-02-22 22:00:00.123456-06:00)
      --US-military-time  Output timestamp in US military time format (ex: 02-22-2022 22:00:00.123 -06:00)
      --US-time           Output timestamp in US time format (ex: 02-22-2022 10:00:00.123 PM -06:00)
  -U, --UTC               Output time in UTC format (default: local time)
log-metrics command ဥပမာများ
- file တစ်ခုတည်းမှ Event ID metrics များကို print ထုတ်ရန်:
hayabusa.exe log-metrics -f Security.evtx - directory တစ်ခုမှ Event ID metrics များကို print ထုတ်ရန်:
hayabusa.exe log-metrics -d ../logs - ရလဒ်များကို CSV file တစ်ခုသို့ သိမ်းဆည်းရန်:
hayabusa.exe log-metrics -d ../logs -o eid-metrics.csv
log-metrics screenshot
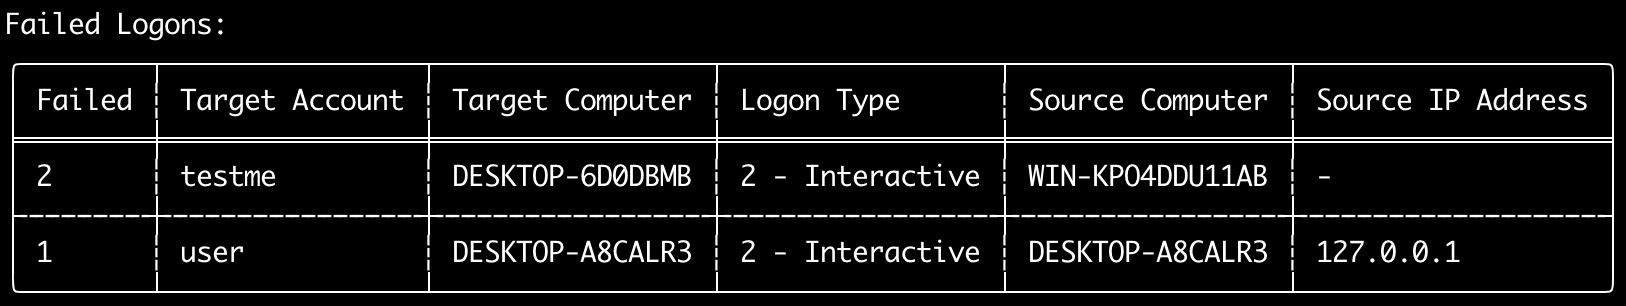
logon-summary command
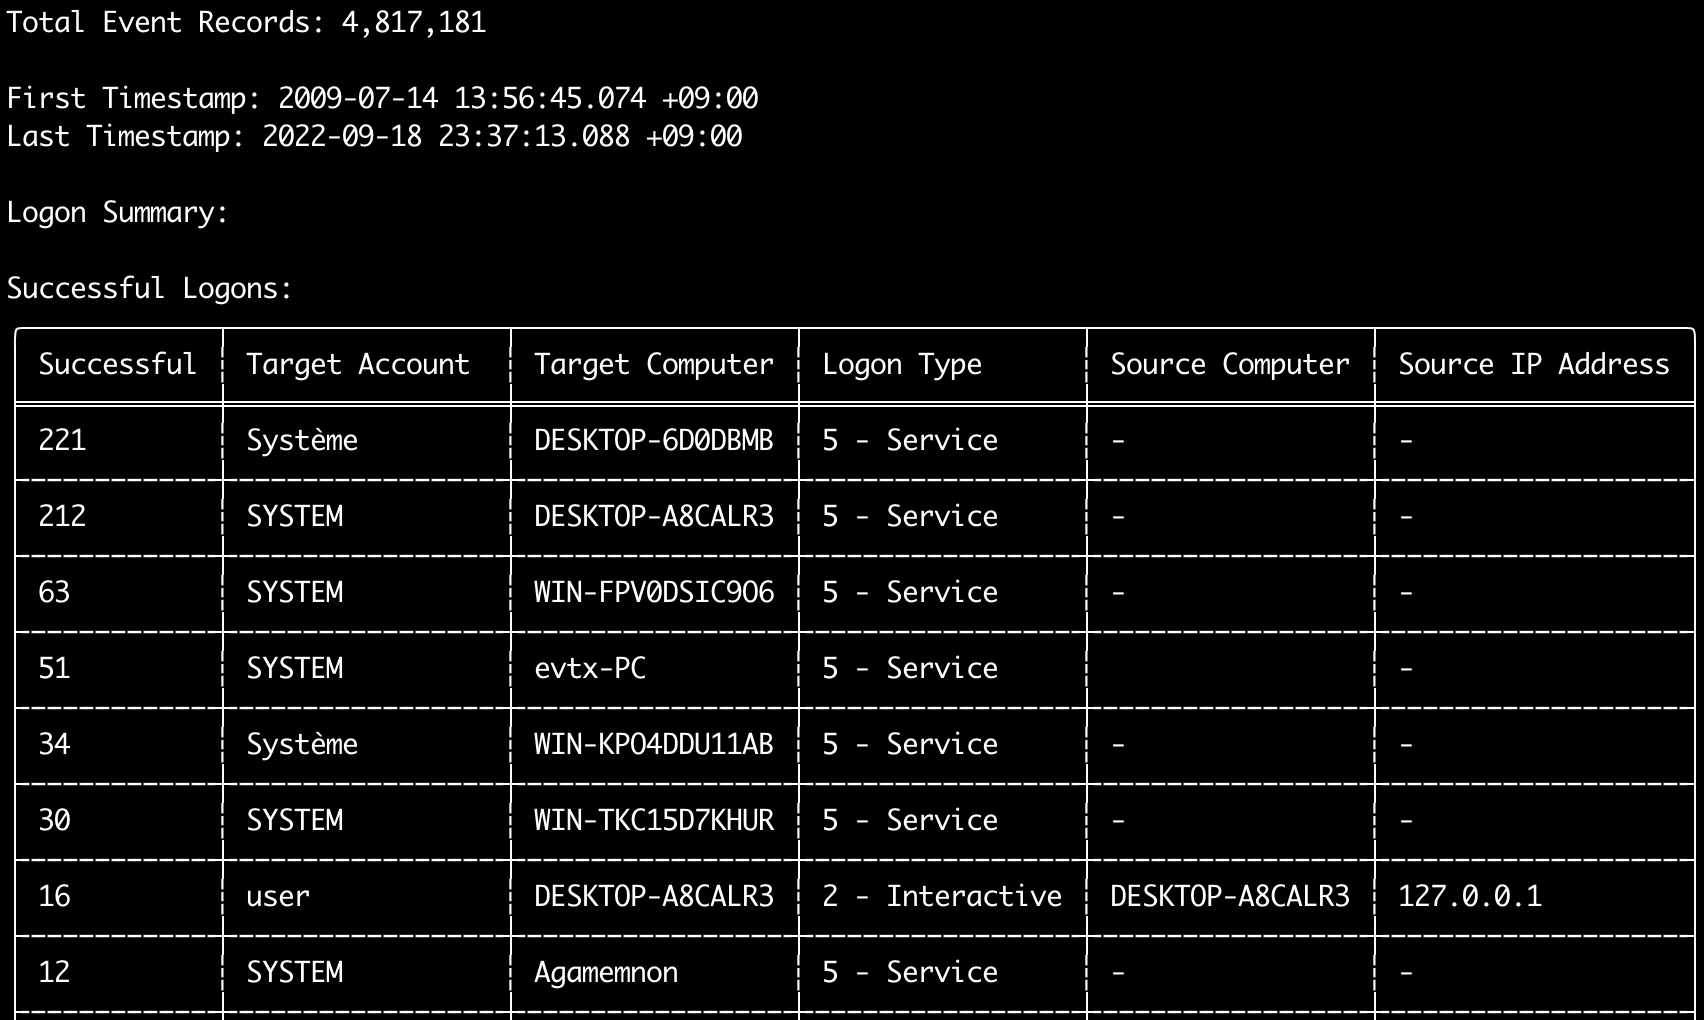
logon အချက်အလက် အကျဉ်းချုပ် (logon username များနှင့် အောင်မြင်/မအောင်မြင်သော logon အရေအတွက်) ကို output ထုတ်ရန် logon-summary command ကို အသုံးပြုနိုင်ပါသည်။
-f ဖြင့် evtx file တစ်ခုတည်း သို့မဟုတ် -d option ဖြင့် evtx file အများအပြားအတွက် logon အချက်အလက်ကို ပြသနိုင်ပါသည်။
အောင်မြင်သော logon များကို အောက်ပါ event များမှ ယူပါသည်:
* Security 4624 (Successful Logon)
* RDS-LSM 21 (Remote Desktop Service Local Session Manager Logon)
* RDS-GTW 302 (Remote Desktop Service Gateway Logon)
မအောင်မြင်သော logon များကို Security 4625 event များမှ ယူပါသည်။
Usage: logon-summary <INPUT> [OPTIONS]

Input:
  -d, --directory <DIR>  Directory of multiple .evtx files
  -f, --file <FILE>      File path to one .evtx file
  -l, --live-analysis    Analyze the local C:\Windows\System32\winevt\Logs folder

General Options:
  -C, --clobber                        Overwrite files when saving
  -h, --help                           Show the help menu
  -J, --JSON-input                     Scan JSON formatted logs instead of .evtx (.json or .jsonl)
  -Q, --quiet-errors                   Quiet errors mode: do not save error logs
  -x, --recover-records                Carve evtx records from slack space (default: disabled)
  -c, --rules-config <DIR>             Specify custom rule config directory (default: ./rules/config)
  -t, --threads <NUMBER>               Number of threads (default: optimal number for performance)
      --target-file-ext <FILE-EXT...>  Specify additional evtx file extensions (ex: evtx_data)

Filtering:
      --exclude-computer <COMPUTER...>  Do not scan specified computer names (ex: ComputerA) (ex: ComputerA,ComputerB)
      --include-computer <COMPUTER...>  Scan only specified computer names (ex: ComputerA) (ex: ComputerA,ComputerB)
      --time-offset <OFFSET>            Scan recent events based on an offset (ex: 1y, 3M, 30d, 24h, 30m)
      --timeline-end <DATE>             End time of the event logs to load (ex: "2022-02-22 23:59:59 +09:00")
      --timeline-start <DATE>           Start time of the event logs to load (ex: "2020-02-22 00:00:00 +09:00")

Output:
  -o, --output <FILENAME-PREFIX>  Save the logon summary to two CSV files (ex: -o logon-summary)

Display Settings:
  -K, --no-color  Disable color output
  -q, --quiet     Quiet mode: do not display the launch banner
  -v, --verbose   Output verbose information

Time Format:
      --European-time     Output timestamp in European time format (ex: 22-02-2022 22:00:00.123 +02:00)
  -O, --ISO-8601          Output timestamp in original ISO-8601 format (ex: 2022-02-22T10:10:10.1234567Z) (Always UTC)
      --RFC-2822          Output timestamp in RFC 2822 format (ex: Fri, 22 Feb 2022 22:00:00 -0600)
      --RFC-3339          Output timestamp in RFC 3339 format (ex: 2022-02-22 22:00:00.123456-06:00)
      --US-military-time  Output timestamp in US military time format (ex: 02-22-2022 22:00:00.123 -06:00)
      --US-time           Output timestamp in US time format (ex: 02-22-2022 10:00:00.123 PM -06:00)
  -U, --UTC               Output time in UTC format (default: local time)
logon-summary command ဥပမာများ
- logon summary ကို print ထုတ်ရန်:
hayabusa.exe logon-summary -f Security.evtx - logon summary ရလဒ်များကို သိမ်းဆည်းရန်:
hayabusa.exe logon-summary -d ../logs -o logon-summary.csv
logon-summary screenshots
pivot-keywords-list command
ပုံမှန်မဟုတ်သော user, hostname, process စသည်တို့ကို လျင်မြန်စွာ ဖော်ထုတ်ရန်နှင့် event များကို ဆက်စပ်ရန်အတွက် ထူးခြားသော pivot keyword များစာရင်းကို ဖန်တီးရန် pivot-keywords-list command ကို အသုံးပြုနိုင်ပါသည်။
အရေးကြီးသည်: default အားဖြင့် hayabusa သည် event အားလုံး (informational နှင့် ၎င်းအထက်) မှ ရလဒ်များကို ပြန်ပေးမည်ဖြစ်သောကြောင့် pivot-keywords-list command ကို -m, --min-level option နှင့် ပေါင်းစပ်အသုံးပြုရန် အလွန်အကြံပြုပါသည်။
ဥပမာအားဖြင့်၊ -m critical ဖြင့် critical alert များမှ keyword များဖန်တီးခြင်းဖြင့် စတင်ပြီး -m high, -m medium စသည်ဖြင့် ဆက်လက်ပါ။
သင်၏ရလဒ်များတွင် ပုံမှန် event များစွာနှင့် ကိုက်ညီမည့် common keyword များ ရှိနိုင်သောကြောင့်၊ ရလဒ်များကို manually စစ်ဆေးပြီး ထူးခြားသော keyword များစာရင်းကို file တစ်ခုတည်းတွင် ဖန်တီးပြီးနောက်၊ grep -f keywords.txt timeline.csv ကဲ့သို့ command တစ်ခုဖြင့် သံသယဖြစ်ဖွယ် လှုပ်ရှားမှုများ၏ ကျဉ်းမြောင်းသွားသော timeline ကို ဖန်တီးနိုင်ပါသည်။
Usage: pivot-keywords-list <INPUT> [OPTIONS]

Input:
  -d, --directory <DIR>  Directory of multiple .evtx files
  -f, --file <FILE>      File path to one .evtx file
  -l, --live-analysis    Analyze the local C:\Windows\System32\winevt\Logs folder

General Options:
  -C, --clobber                        Overwrite files when saving
  -h, --help                           Show the help menu
  -J, --JSON-input                     Scan JSON formatted logs instead of .evtx (.json or .jsonl)
  -w, --no-wizard                      Do not ask questions. Scan for all events and alerts
  -Q, --quiet-errors                   Quiet errors mode: do not save error logs
  -x, --recover-records                Carve evtx records from slack space (default: disabled)
  -c, --rules-config <DIR>             Specify custom rule config directory (default: ./rules/config)
  -t, --threads <NUMBER>               Number of threads (default: optimal number for performance)
      --target-file-ext <FILE-EXT...>  Specify additional evtx file extensions (ex: evtx_data)

Filtering:
  -E, --EID-filter                      Scan only common EIDs for faster speed (./rules/config/target_event_IDs.txt)
  -D, --enable-deprecated-rules         Enable rules with a status of deprecated
  -n, --enable-noisy-rules              Enable rules set to noisy (./rules/config/noisy_rules.txt)
  -u, --enable-unsupported-rules        Enable rules with a status of unsupported
  -e, --exact-level <LEVEL>             Only load rules with a specific level (informational, low, medium, high, critical)
      --exclude-computer <COMPUTER...>  Do not scan specified computer names (ex: ComputerA) (ex: ComputerA,ComputerB)
      --exclude-eid <EID...>            Do not scan specific EIDs for faster speed (ex: 1) (ex: 1,4688)
      --exclude-status <STATUS...>      Do not load rules according to status (ex: experimental) (ex: stable,test)
      --exclude-tag <TAG...>            Do not load rules with specific tags (ex: sysmon)
      --include-computer <COMPUTER...>  Scan only specified computer names (ex: ComputerA) (ex: ComputerA,ComputerB)
      --include-eid <EID...>            Scan only specified EIDs for faster speed (ex: 1) (ex: 1,4688)
      --include-status <STATUS...>      Only load rules with specific status (ex: experimental) (ex: stable,test)
      --include-tag <TAG...>            Only load rules with specific tags (ex: attack.execution,attack.discovery)
  -m, --min-level <LEVEL>               Minimum level for rules to load (default: informational)
      --time-offset <OFFSET>            Scan recent events based on an offset (ex: 1y, 3M, 30d, 24h, 30m)
      --timeline-end <DATE>             End time of the event logs to load (ex: "2022-02-22 23:59:59 +09:00")
      --timeline-start <DATE>           Start time of the event logs to load (ex: "2020-02-22 00:00:00 +09:00")

Output:
  -o, --output <FILENAME-PREFIX>  Save pivot words to separate files (ex: PivotKeywords)

Display Settings:
  -K, --no-color  Disable color output
  -q, --quiet     Quiet mode: do not display the launch banner
  -v, --verbose   Output verbose information
pivot-keywords-list command ဥပမာများ
- pivot keyword များကို မျက်နှာပြင်သို့ output ထုတ်ရန်:
hayabusa.exe pivot-keywords-list -d ../logs -m critical - critical alert များမှ pivot keyword များစာရင်းကို ဖန်တီး၍ ရလဒ်များကို သိမ်းဆည်းရန်။ (ရလဒ်များကို
keywords-Ip Addresses.txt,keywords-Users.txtစသည်တို့သို့ သိမ်းဆည်းပါမည်):
pivot-keywords-list config file
./rules/config/pivot_keywords.txt ကို တည်းဖြတ်ခြင်းဖြင့် ရှာဖွေလိုသော keyword များကို စိတ်ကြိုက်ပြင်ဆင်နိုင်ပါသည်။
ဤစာမျက်နှာ သည် default setting ဖြစ်ပါသည်။
format မှာ KeywordName.FieldName ဖြစ်ပါသည်။ ဥပမာအားဖြင့်၊ Users စာရင်းကို ဖန်တီးသည့်အခါ hayabusa သည် SubjectUserName, TargetUserName နှင့် User field များရှိ တန်ဖိုးအားလုံးကို စာရင်းပြုစုပါမည်။
search command
search command သည် event အားလုံးအပေါ် keyword ရှာဖွေမှု ပြုလုပ်နိုင်စေပါသည်။
(Hayabusa detection ရလဒ်များ သက်သက်မဟုတ်ပါ။)
ဤအချက်သည် Hayabusa မှ ဖော်ထုတ်မထားသော event များတွင် သက်သေအထောက်အထား တစ်စုံတစ်ရာ ရှိမရှိ ဆုံးဖြတ်ရာတွင် အသုံးဝင်ပါသည်။
Usage: hayabusa.exe search <INPUT> <--keywords "<KEYWORDS>" OR --regex "<REGEX>"> [OPTIONS]

Display Settings:
  -K, --no-color  Disable color output
  -q, --quiet     Quiet mode: do not display the launch banner
  -v, --verbose   Output verbose information

General Options:
  -C, --clobber                        Overwrite files when saving
  -h, --help                           Show the help menu
  -Q, --quiet-errors                   Quiet errors mode: do not save error logs
  -x, --recover-records                Carve evtx records from slack space (default: disabled)
  -c, --rules-config <DIR>             Specify custom rule config directory (default: ./rules/config)
  -t, --threads <NUMBER>               Number of threads (default: optimal number for performance)
      --target-file-ext <FILE-EXT...>  Specify additional evtx file extensions (ex: evtx_data)
  -s, --sort                           Sort results before saving the file (warning: this uses much more memory!)

Input:
  -d, --directory <DIR>  Directory of multiple .evtx files
  -f, --file <FILE>      File path to one .evtx file
  -l, --live-analysis    Analyze the local C:\Windows\System32\winevt\Logs folder

Filtering:
  -a, --and-logic              Search keywords with AND logic (default: OR)
  -F, --filter <FILTER...>     Filter by specific field(s)
  -i, --ignore-case            Case-insensitive keyword search
  -k, --keyword <KEYWORD...>   Search by keyword(s)
  -r, --regex <REGEX>          Search by regular expression
      --time-offset <OFFSET>   Scan recent events based on an offset (ex: 1y, 3M, 30d, 24h, 30m)
      --timeline-end <DATE>    End time of the event logs to load (ex: "2022-02-22 23:59:59 +09:00")
      --timeline-start <DATE>  Start time of the event logs to load (ex: "2020-02-22 00:00:00 +09:00")

Output:
  -b, --disable-abbreviations  Disable abbreviations
  -J, --JSON-output            Save the search results in JSON format (ex: -J -o results.json)
  -L, --JSONL-output           Save the search results in JSONL format (ex: -L -o results.jsonl)
  -M, --multiline              Output event field information in multiple rows for CSV output
  -o, --output <FILE>          Save the search results in CSV format (ex: search.csv)
  -S, --tab-separator          Separate event field information by tabs

Time Format:
      --European-time     Output timestamp in European time format (ex: 22-02-2022 22:00:00.123 +02:00)
  -O, --ISO-8601          Output timestamp in original ISO-8601 format (ex: 2022-02-22T10:10:10.1234567Z) (Always UTC)
      --RFC-2822          Output timestamp in RFC 2822 format (ex: Fri, 22 Feb 2022 22:00:00 -0600)
      --RFC-3339          Output timestamp in RFC 3339 format (ex: 2022-02-22 22:00:00.123456-06:00)
      --US-military-time  Output timestamp in US military time format (ex: 02-22-2022 22:00:00.123 -06:00)
      --US-time           Output timestamp in US time format (ex: 02-22-2022 10:00:00.123 PM -06:00)
  -U, --UTC               Output time in UTC format (default: local time)
search command ဥပမာများ
../hayabusa-sample-evtxdirectory ကိုmimikatzkeyword အတွက် ရှာဖွေရန်:
မှတ်ချက်:
mimikatzကို data အတွင်း မည်သည့်နေရာတွင်မဆို တွေ့ရှိပါက keyword ကိုက်ညီပါမည်။ ၎င်းသည် တိကျသော ကိုက်ညီမှု မဟုတ်ပါ။
../hayabusa-sample-evtxdirectory ကိုmimikatzသို့မဟုတ်kalikeyword များအတွက် ရှာဖွေရန်:
../hayabusa-sample-evtxdirectory ကိုmimikatzkeyword အတွက် အက္ခရာအကြီးအသေး လျစ်လျူရှု၍ ရှာဖွေရန်:
../hayabusa-sample-evtxdirectory ကို regular expression များ အသုံးပြု၍ IP address များအတွက် ရှာဖွေရန်:
../hayabusa-sample-evtxdirectory ကို ရှာဖွေ၍WorkstationNamefield သည်kaliဖြစ်သော event အားလုံးကို ပြသရန်:
မှတ်ချက်:
.*သည် event တိုင်းနှင့် ကိုက်ညီစေသော regular expression ဖြစ်ပါသည်။
search command config file များ
./rules/config/channel_abbreviations.txt: channel အမည်များနှင့် ၎င်းတို့၏ အတိုကောက်များ၏ mapping များ။