Commandes d'analyse
Commande computer-metrics
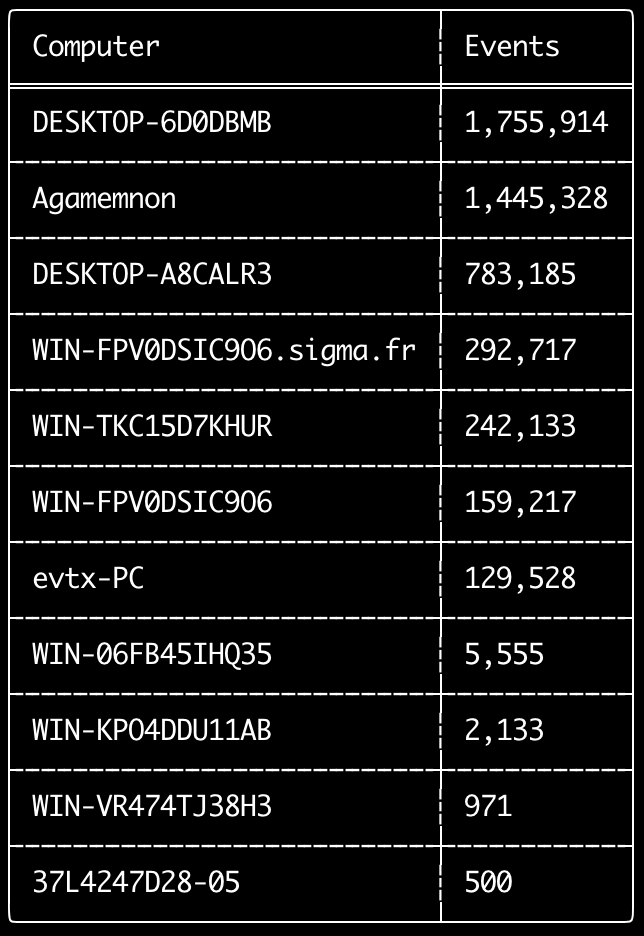
Vous pouvez utiliser la commande computer-metrics pour vérifier combien d'événements existent pour chaque ordinateur défini dans le champ <System><Computer>.
Sachez que vous ne pouvez pas vous fier entièrement au champ Computer pour séparer les événements par leur ordinateur d'origine.
Windows 11 utilise parfois des noms de Computer complètement différents lors de l'enregistrement dans les journaux d'événements.
De plus, Windows 10 enregistre parfois le nom de Computer entièrement en minuscules.
Cette commande n'utilise aucune règle de détection et analysera donc tous les événements.
C'est une bonne commande à exécuter pour voir rapidement quels ordinateurs ont le plus de journaux.
Avec ces informations, vous pouvez ensuite utiliser les options --include-computer ou --exclude-computer lors de la création de vos chronologies afin de rendre la génération de votre chronologie plus efficace en créant plusieurs chronologies par ordinateur ou en excluant les événements de certains ordinateurs.
Usage: computer-metrics <INPUT> [OPTIONS]

Input:
  -d, --directory <DIR>  Directory of multiple .evtx files
  -f, --file <FILE>      File path to one .evtx file
  -l, --live-analysis    Analyze the local C:\Windows\System32\winevt\Logs folder

General Options:
  -C, --clobber                        Overwrite files when saving
  -h, --help                           Show the help menu
  -J, --JSON-input                     Scan JSON formatted logs instead of .evtx (.json or .jsonl)
  -Q, --quiet-errors                   Quiet errors mode: do not save error logs
  -x, --recover-records                Carve evtx records from slack space (default: disabled)
  -c, --rules-config <DIR>             Specify custom rule config directory (default: ./rules/config)
      --target-file-ext <FILE-EXT...>  Specify additional evtx file extensions (ex: evtx_data)
  -t, --threads <NUMBER>               Number of threads (default: optimal number for performance)

Filtering:
      --time-offset <OFFSET>  Scan recent events based on an offset (ex: 1y, 3M, 30d, 24h, 30m)

Output:
  -o, --output <FILE>  Save the results in CSV format (ex: computer-metrics.csv)

Display Settings:
  -K, --no-color  Disable color output
  -q, --quiet     Quiet mode: do not display the launch banner
  -v, --verbose   Output verbose information
Exemples de la commande computer-metrics
- Afficher les métriques de noms d'ordinateurs depuis un répertoire :
hayabusa.exe computer-metrics -d ../logs - Enregistrer les résultats dans un fichier CSV :
hayabusa.exe computer-metrics -d ../logs -o computer-metrics.csv
Capture d'écran de computer-metrics
Commande eid-metrics
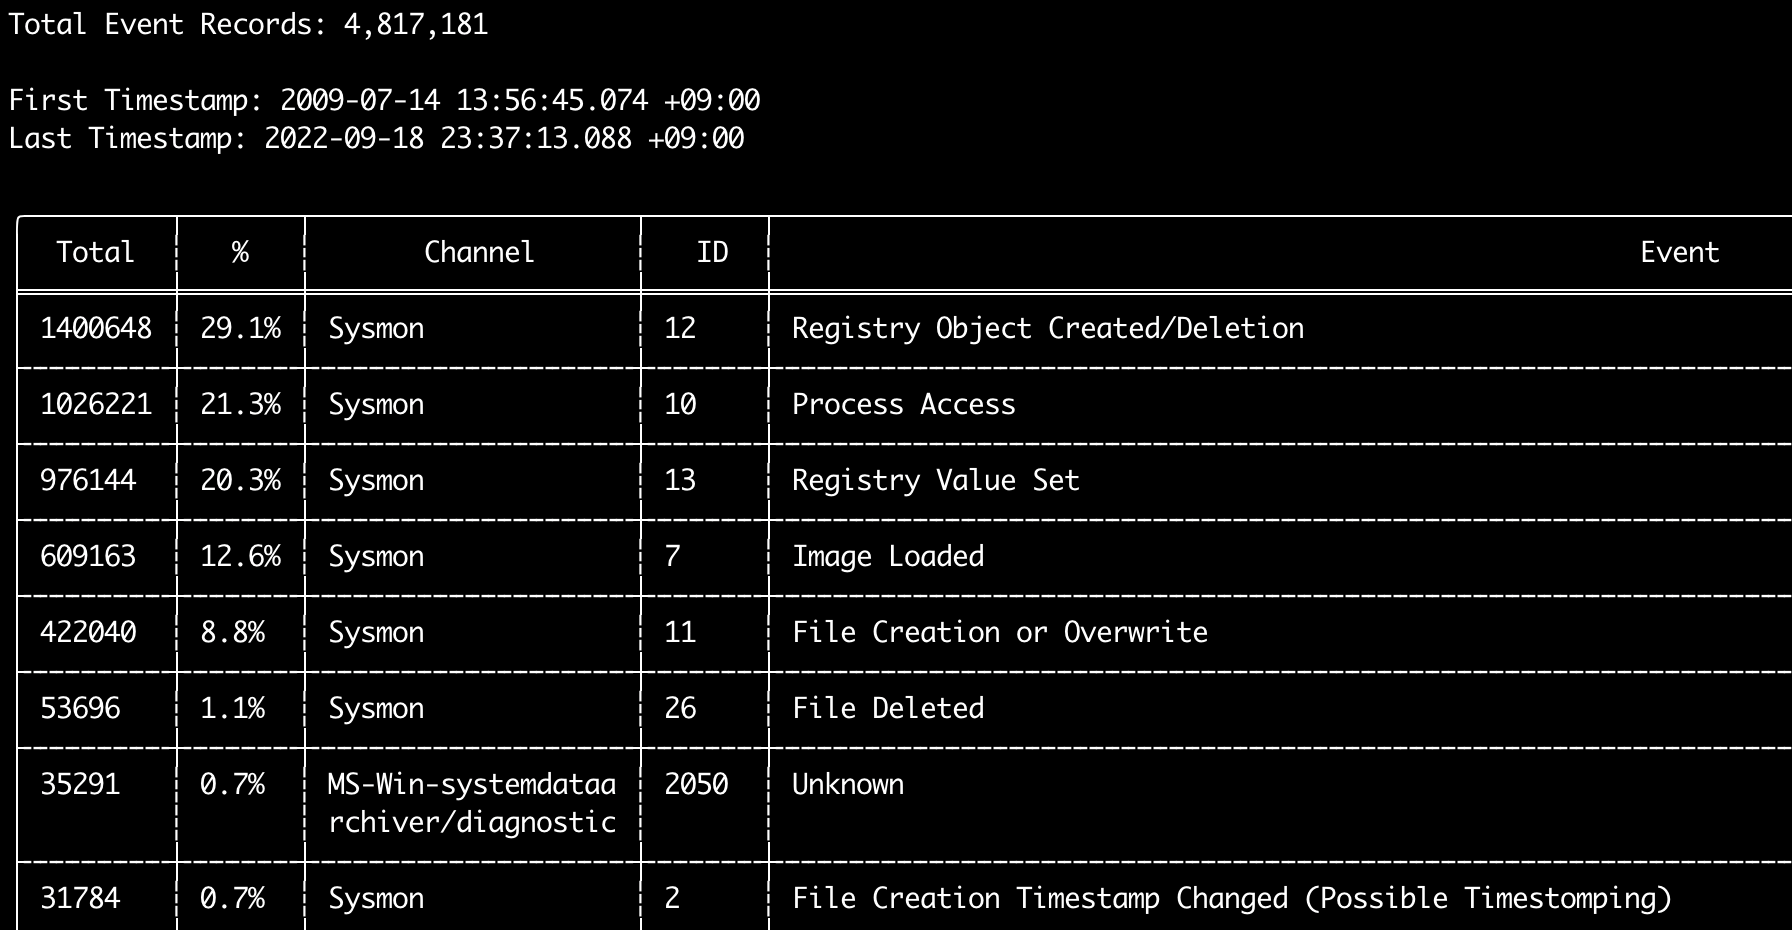
Vous pouvez utiliser la commande eid-metrics pour afficher le nombre total et le pourcentage d'identifiants d'événements (champ <System><EventID>) séparés par canaux.
Cette commande n'utilise aucune règle de détection et analysera donc tous les événements.
Usage: eid-metrics <INPUT> [OPTIONS]

Input:
  -d, --directory <DIR>  Directory of multiple .evtx files
  -f, --file <FILE>      File path to one .evtx file
  -l, --live-analysis    Analyze the local C:\Windows\System32\winevt\Logs folder

General Options:
  -C, --clobber                        Overwrite files when saving
  -h, --help                           Show the help menu
  -J, --JSON-input                     Scan JSON formatted logs instead of .evtx (.json or .jsonl)
  -Q, --quiet-errors                   Quiet errors mode: do not save error logs
  -x, --recover-records                Carve evtx records from slack space (default: disabled)
  -c, --rules-config <DIR>             Specify custom rule config directory (default: ./rules/config)
  -t, --threads <NUMBER>               Number of threads (default: optimal number for performance)
      --target-file-ext <FILE-EXT...>  Specify additional evtx file extensions (ex: evtx_data)

Filtering:
      --exclude-computer <COMPUTER...>  Do not scan specified computer names (ex: ComputerA) (ex: ComputerA,ComputerB)
      --include-computer <COMPUTER...>  Scan only specified computer names (ex: ComputerA) (ex: ComputerA,ComputerB)
      --time-offset <OFFSET>            Scan recent events based on an offset (ex: 1y, 3M, 30d, 24h, 30m)

Output:
  -b, --disable-abbreviations  Disable abbreviations
  -o, --output <FILE>          Save the Metrics in CSV format (ex: metrics.csv)

Display Settings:
  -K, --no-color  Disable color output
  -q, --quiet     Quiet mode: do not display the launch banner
  -v, --verbose   Output verbose information

Time Format:
      --European-time     Output timestamp in European time format (ex: 22-02-2022 22:00:00.123 +02:00)
  -O, --ISO-8601          Output timestamp in original ISO-8601 format (ex: 2022-02-22T10:10:10.1234567Z) (Always UTC)
      --RFC-2822          Output timestamp in RFC 2822 format (ex: Fri, 22 Feb 2022 22:00:00 -0600)
      --RFC-3339          Output timestamp in RFC 3339 format (ex: 2022-02-22 22:00:00.123456-06:00)
      --US-military-time  Output timestamp in US military time format (ex: 02-22-2022 22:00:00.123 -06:00)
      --US-time           Output timestamp in US time format (ex: 02-22-2022 10:00:00.123 PM -06:00)
  -U, --UTC               Output time in UTC format (default: local time)
Exemples de la commande eid-metrics
- Afficher les métriques d'identifiants d'événements depuis un seul fichier :
hayabusa.exe eid-metrics -f Security.evtx - Afficher les métriques d'identifiants d'événements depuis un répertoire :
hayabusa.exe eid-metrics -d ../logs - Enregistrer les résultats dans un fichier CSV :
hayabusa.exe eid-metrics -f Security.evtx -o eid-metrics.csv
Fichier de configuration de la commande eid-metrics
Le canal, les identifiants d'événements et les titres des événements sont définis dans rules/config/channel_eid_info.txt.
Exemple :
Channel,EventID,EventTitle
Microsoft-Windows-Sysmon/Operational,1,Process Creation.
Microsoft-Windows-Sysmon/Operational,2,File Creation Timestamp Changed. (Possible Timestomping)
Microsoft-Windows-Sysmon/Operational,3,Network Connection.
Microsoft-Windows-Sysmon/Operational,4,Sysmon Service State Changed.
Capture d'écran de eid-metrics
Commande expand-list
Extrait les espaces réservés expand du dossier des règles.
Ceci est utile lors de la création de fichiers de configuration pour utiliser toute règle qui utilise le modificateur de champ expand.
Pour utiliser les règles expand, il vous suffit de créer un fichier .txt portant le nom du modificateur de champ expand dans le répertoire ./config/expand/, et d'y placer toutes les valeurs que vous souhaitez vérifier.
Par exemple, si la logique de detection de la règle est :
detection:
    selection:
        EventID: 5145
        RelativeTargetName|contains: '\winreg'
    filter_main:
        IpAddress|expand: '%Admins_Workstations%'
    condition: selection and not filter_main
vous créeriez le fichier texte ./config/expand/Admins_Workstations.txt et y mettriez des valeurs telles que :
Cela vérifierait essentiellement la même logique que :
Si le fichier de configuration n'existe pas, Hayabusa chargera quand même la règle expand mais l'ignorera.
Usage:  expand-list <INPUT> [OPTIONS]

General Options:
  -h, --help              Show the help menu
  -r, --rules <DIR/FILE>  Specify rule directory (default: ./rules)

Display Settings:
  -K, --no-color  Disable color output
  -q, --quiet     Quiet mode: do not display the launch banner
Exemples de la commande expand-list
- Extraire les modificateurs de champ
expanddu répertoirerulespar défaut :hayabusa.exe expand-list - Extraire les modificateurs de champ
expanddu répertoiresigma:hayabusa.exe eid-metrics -r ../sigma
Résultats de expand-list
5 unique expand placeholders found:
Admins_Workstations
DC-MACHINE-NAME
Workstations
internal_domains
domain_controller_hostnames
Commande extract-base64
Cette commande extraira les chaînes base64 des événements suivants, les décodera et indiquera quel type d'encodage est utilisé. * Security 4688 CommandLine * Sysmon 1 CommandLine, ParentCommandLine * System 7045 ImagePath * PowerShell Operational 4104 * PowerShell Operational 4103
Usage:  extract-base64 <INPUT> [OPTIONS]

Input:
  -d, --directory <DIR>  Directory of multiple .evtx files
  -f, --file <FILE>      File path to one .evtx file
  -l, --live-analysis    Analyze the local C:\Windows\System32\winevt\Logs folder

General Options:
  -C, --clobber                        Overwrite files when saving
  -h, --help                           Show the help menu
  -J, --JSON-input                     Scan JSON formatted logs instead of .evtx (.json or .jsonl)
  -Q, --quiet-errors                   Quiet errors mode: do not save error logs
  -x, --recover-records                Carve evtx records from slack space (default: disabled)
  -c, --rules-config <DIR>             Specify custom rule config directory (default: ./rules/config)
  -t, --threads <NUMBER>               Number of threads (default: optimal number for performance)
      --target-file-ext <FILE-EXT...>  Specify additional evtx file extensions (ex: evtx_data)

Filtering:
      --exclude-computer <COMPUTER...>  Do not scan specified computer names (ex: ComputerA) (ex: ComputerA,ComputerB)
      --include-computer <COMPUTER...>  Scan only specified computer names (ex: ComputerA) (ex: ComputerA,ComputerB)
      --time-offset <OFFSET>            Scan recent events based on an offset (ex: 1y, 3M, 30d, 24h, 30m)

Output:
  -o, --output <FILE>  Extract Base64 strings

Display Settings:
  -K, --no-color  Disable color output
  -q, --quiet     Quiet mode: do not display the launch banner
  -v, --verbose   Output verbose information

Time Format:
      --European-time     Output timestamp in European time format (ex: 22-02-2022 22:00:00.123 +02:00)
  -O, --ISO-8601          Output timestamp in original ISO-8601 format (ex: 2022-02-22T10:10:10.1234567Z) (Always UTC)
      --RFC-2822          Output timestamp in RFC 2822 format (ex: Fri, 22 Feb 2022 22:00:00 -0600)
      --RFC-3339          Output timestamp in RFC 3339 format (ex: 2022-02-22 22:00:00.123456-06:00)
      --US-military-time  Output timestamp in US military time format (ex: 02-22-2022 22:00:00.123 -06:00)
      --US-time           Output timestamp in US time format (ex: 02-22-2022 10:00:00.123 PM -06:00)
  -U, --UTC               Output time in UTC format (default: local time)
Exemples de la commande extract-base64
- Analyser un répertoire et afficher dans le terminal :
hayabusa.exe extract-base64 -d ../hayabusa-sample-evtx - Analyser un répertoire et écrire dans un fichier CSV :
hayabusa.exe eid-metrics -r ../sigma -o base64-extracted.csv
Résultats de extract-base64
Lors de l'affichage dans le terminal, comme l'espace est limité, seuls les champs suivants sont affichés : * Timestamp * Computer * Base64 String * Decoded String (if not binary)
Lors de l'enregistrement dans un fichier CSV, les champs suivants sont enregistrés :
* Timestamp
* Computer
* Base64 String
* Decoded String (if not binary)
* Original Field
* Length
* Binary (Y/N)
* Double Encoding (when Y, it usually is malicious)
* Encoding Type
* File Type
* Event
* Record ID
* File Name
Commande log-metrics
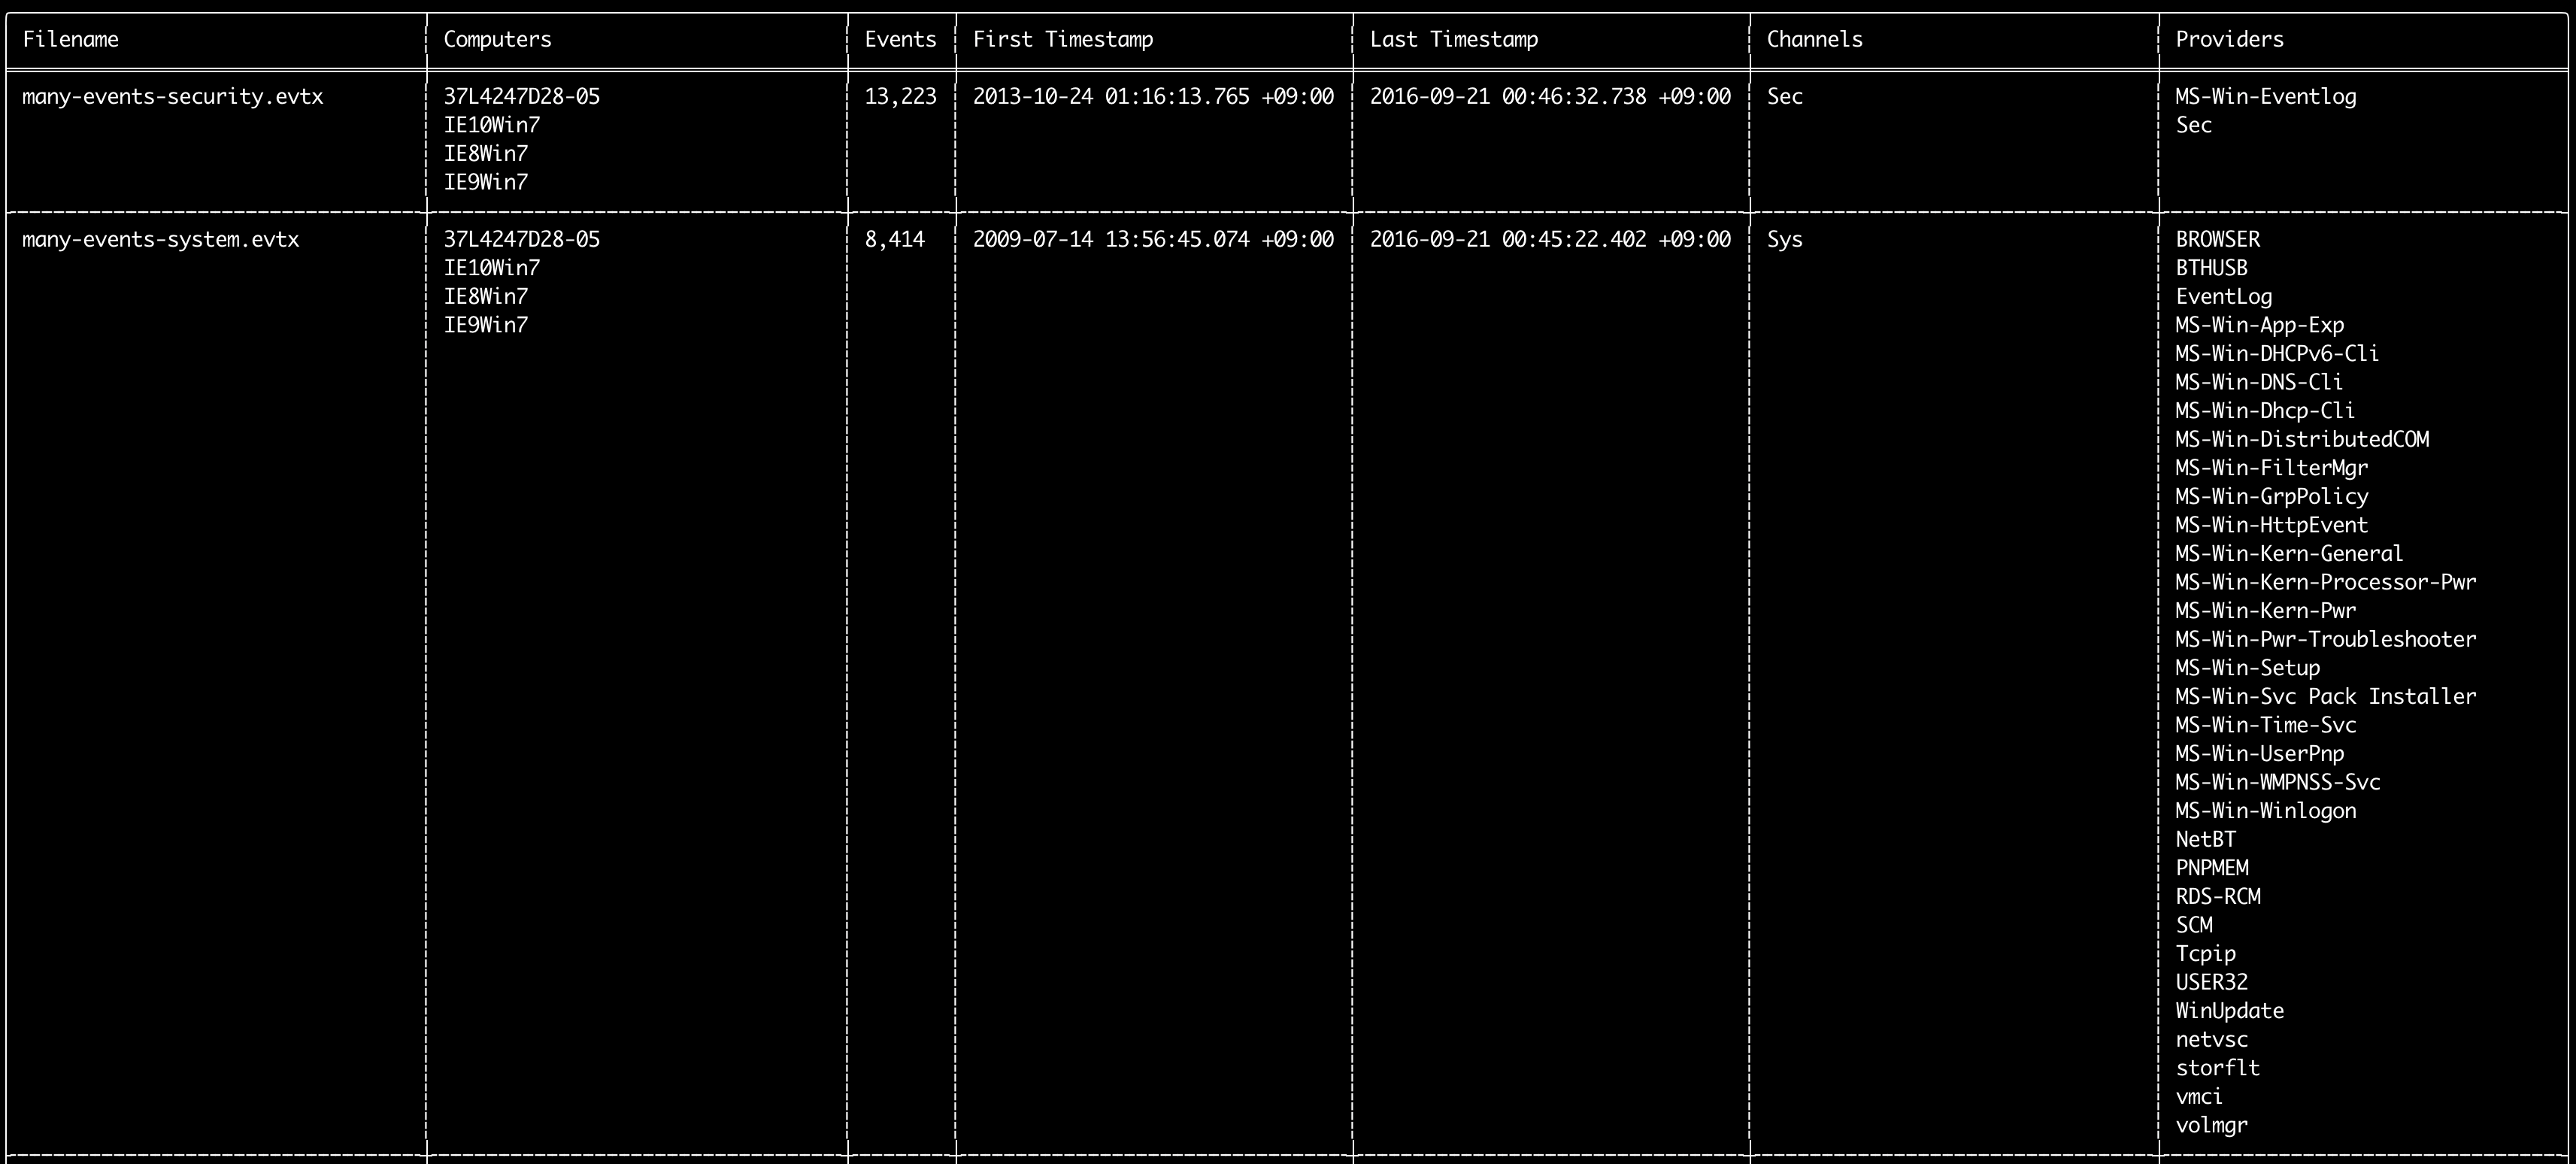
Vous pouvez utiliser la commande log-metrics pour afficher les métadonnées suivantes contenues dans les journaux d'événements :
* Filename
* Computer names
* Number of events
* First timestamp
* Last timestamp
* Channels
* Providers
Cette commande n'utilise aucune règle de détection et analysera donc tous les événements.
Usage: log-metrics <INPUT> [OPTIONS]

Input:
  -d, --directory <DIR>  Directory of multiple .evtx files
  -f, --file <FILE>      File path to one .evtx file
  -l, --live-analysis    Analyze the local C:\Windows\System32\winevt\Logs folder

General Options:
  -C, --clobber                        Overwrite files when saving
  -h, --help                           Show the help menu
  -J, --JSON-input                     Scan JSON formatted logs instead of .evtx (.json or .jsonl)
  -Q, --quiet-errors                   Quiet errors mode: do not save error logs
  -x, --recover-records                Carve evtx records from slack space (default: disabled)
  -c, --rules-config <DIR>             Specify custom rule config directory (default: ./rules/config)
  -t, --threads <NUMBER>               Number of threads (default: optimal number for performance)
      --target-file-ext <FILE-EXT...>  Specify additional evtx file extensions (ex: evtx_data)

Filtering:
      --exclude-computer <COMPUTER...>  Do not scan specified computer names (ex: ComputerA) (ex: ComputerA,ComputerB)
      --include-computer <COMPUTER...>  Scan only specified computer names (ex: ComputerA) (ex: ComputerA,ComputerB)
      --time-offset <OFFSET>            Scan recent events based on an offset (ex: 1y, 3M, 30d, 24h, 30m)

Output:
  -b, --disable-abbreviations  Disable abbreviations
  -M, --multiline              Output event field information in multiple rows for CSV output
  -o, --output <FILE>          Save the Metrics in CSV format (ex: metrics.csv)
  -S, --tab-separator          Separate event field information by tabs

Display Settings:
  -K, --no-color  Disable color output
  -q, --quiet     Quiet mode: do not display the launch banner
  -v, --verbose   Output verbose information

Time Format:
      --European-time     Output timestamp in European time format (ex: 22-02-2022 22:00:00.123 +02:00)
  -O, --ISO-8601          Output timestamp in original ISO-8601 format (ex: 2022-02-22T10:10:10.1234567Z) (Always UTC)
      --RFC-2822          Output timestamp in RFC 2822 format (ex: Fri, 22 Feb 2022 22:00:00 -0600)
      --RFC-3339          Output timestamp in RFC 3339 format (ex: 2022-02-22 22:00:00.123456-06:00)
      --US-military-time  Output timestamp in US military time format (ex: 02-22-2022 22:00:00.123 -06:00)
      --US-time           Output timestamp in US time format (ex: 02-22-2022 10:00:00.123 PM -06:00)
  -U, --UTC               Output time in UTC format (default: local time)
Exemples de la commande log-metrics
- Afficher les métriques d'identifiants d'événements depuis un seul fichier :
hayabusa.exe log-metrics -f Security.evtx - Afficher les métriques d'identifiants d'événements depuis un répertoire :
hayabusa.exe log-metrics -d ../logs - Enregistrer les résultats dans un fichier CSV :
hayabusa.exe log-metrics -d ../logs -o eid-metrics.csv
Capture d'écran de log-metrics
Commande logon-summary
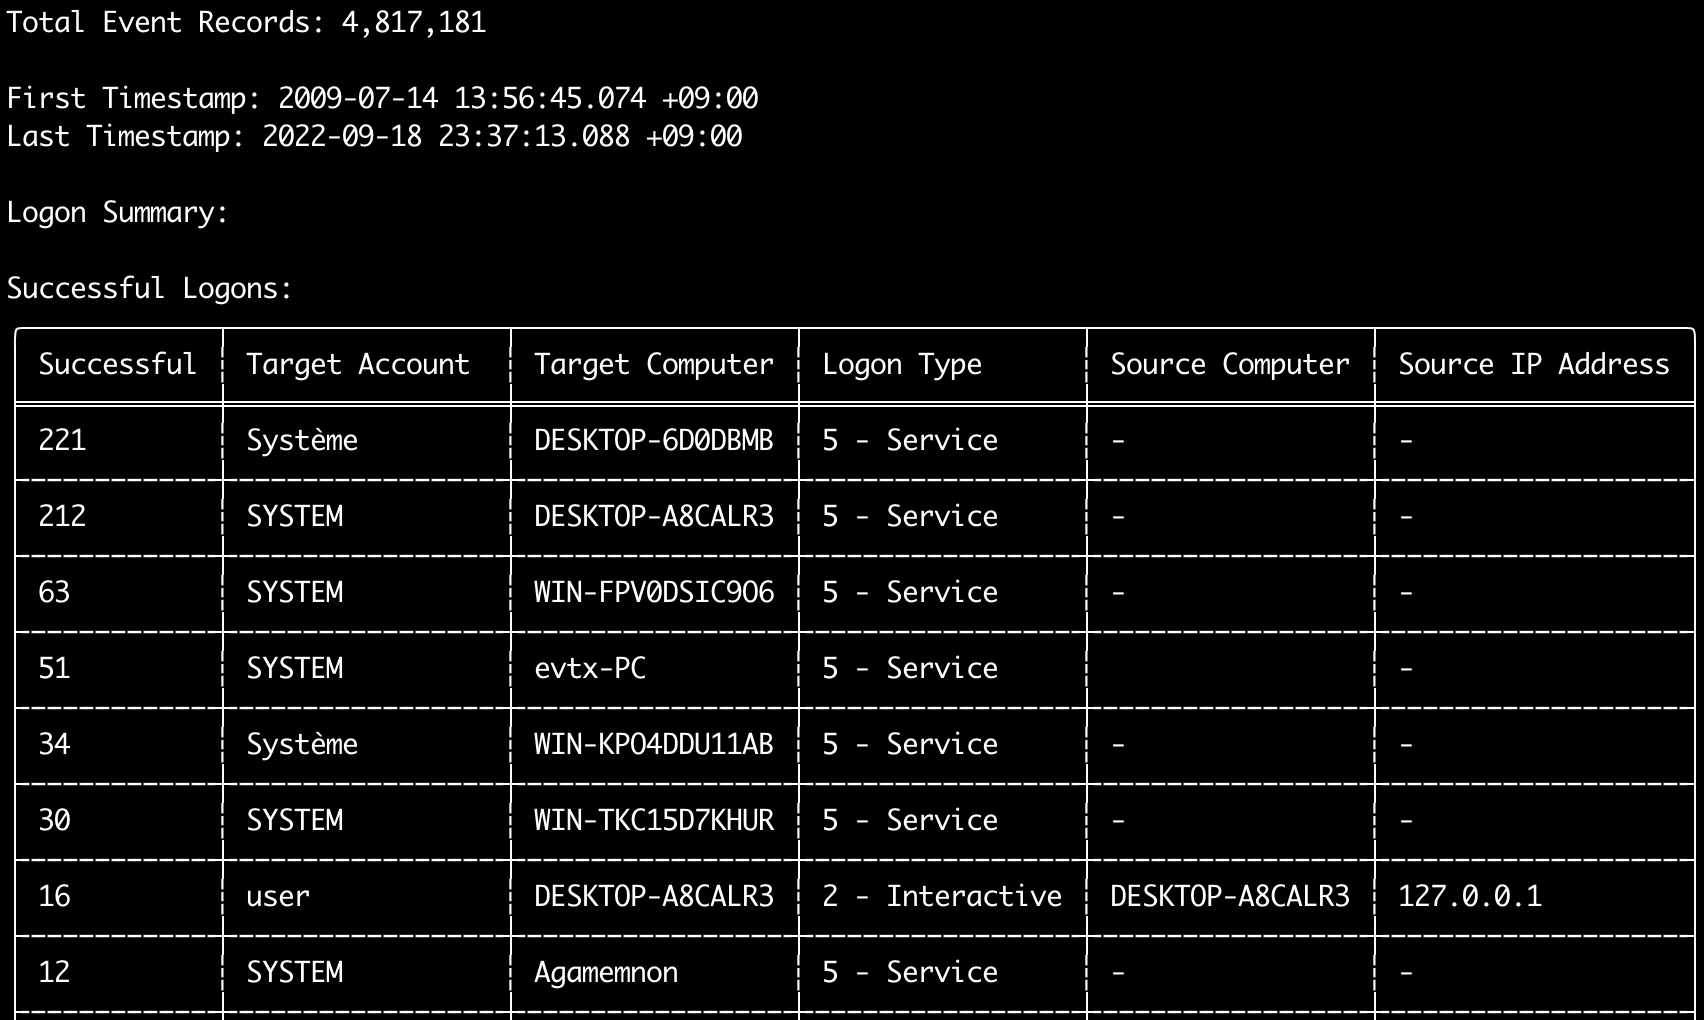
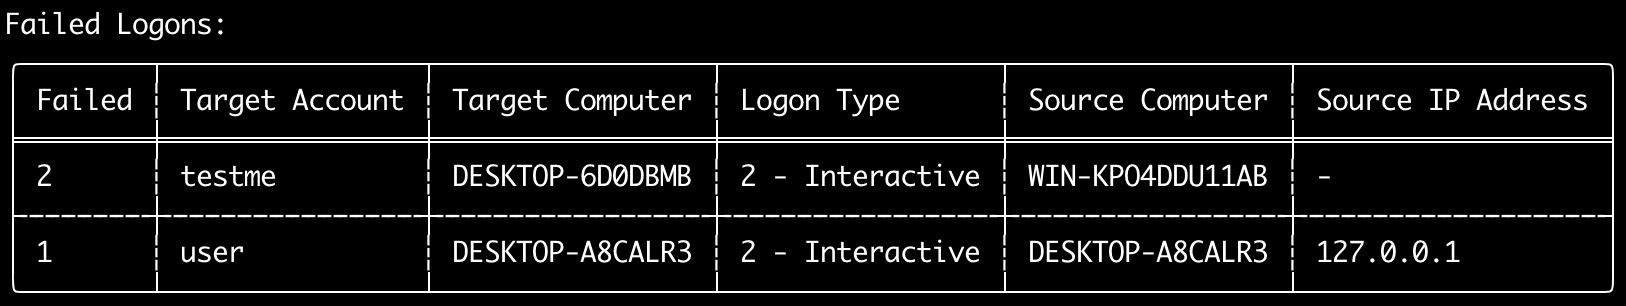
Vous pouvez utiliser la commande logon-summary pour produire un résumé des informations de connexion (noms d'utilisateurs de connexion et nombre de connexions réussies et échouées).
Vous pouvez afficher les informations de connexion pour un seul fichier evtx avec -f ou pour plusieurs fichiers evtx avec l'option -d.
Les connexions réussies sont issues des événements suivants :
* Security 4624 (Successful Logon)
* RDS-LSM 21 (Remote Desktop Service Local Session Manager Logon)
* RDS-GTW 302 (Remote Desktop Service Gateway Logon)
Les connexions échouées sont issues des événements Security 4625.
Usage: logon-summary <INPUT> [OPTIONS]

Input:
  -d, --directory <DIR>  Directory of multiple .evtx files
  -f, --file <FILE>      File path to one .evtx file
  -l, --live-analysis    Analyze the local C:\Windows\System32\winevt\Logs folder

General Options:
  -C, --clobber                        Overwrite files when saving
  -h, --help                           Show the help menu
  -J, --JSON-input                     Scan JSON formatted logs instead of .evtx (.json or .jsonl)
  -Q, --quiet-errors                   Quiet errors mode: do not save error logs
  -x, --recover-records                Carve evtx records from slack space (default: disabled)
  -c, --rules-config <DIR>             Specify custom rule config directory (default: ./rules/config)
  -t, --threads <NUMBER>               Number of threads (default: optimal number for performance)
      --target-file-ext <FILE-EXT...>  Specify additional evtx file extensions (ex: evtx_data)

Filtering:
      --exclude-computer <COMPUTER...>  Do not scan specified computer names (ex: ComputerA) (ex: ComputerA,ComputerB)
      --include-computer <COMPUTER...>  Scan only specified computer names (ex: ComputerA) (ex: ComputerA,ComputerB)
      --time-offset <OFFSET>            Scan recent events based on an offset (ex: 1y, 3M, 30d, 24h, 30m)
      --timeline-end <DATE>             End time of the event logs to load (ex: "2022-02-22 23:59:59 +09:00")
      --timeline-start <DATE>           Start time of the event logs to load (ex: "2020-02-22 00:00:00 +09:00")

Output:
  -o, --output <FILENAME-PREFIX>  Save the logon summary to two CSV files (ex: -o logon-summary)

Display Settings:
  -K, --no-color  Disable color output
  -q, --quiet     Quiet mode: do not display the launch banner
  -v, --verbose   Output verbose information

Time Format:
      --European-time     Output timestamp in European time format (ex: 22-02-2022 22:00:00.123 +02:00)
  -O, --ISO-8601          Output timestamp in original ISO-8601 format (ex: 2022-02-22T10:10:10.1234567Z) (Always UTC)
      --RFC-2822          Output timestamp in RFC 2822 format (ex: Fri, 22 Feb 2022 22:00:00 -0600)
      --RFC-3339          Output timestamp in RFC 3339 format (ex: 2022-02-22 22:00:00.123456-06:00)
      --US-military-time  Output timestamp in US military time format (ex: 02-22-2022 22:00:00.123 -06:00)
      --US-time           Output timestamp in US time format (ex: 02-22-2022 10:00:00.123 PM -06:00)
  -U, --UTC               Output time in UTC format (default: local time)
Exemples de la commande logon-summary
- Afficher le résumé des connexions :
hayabusa.exe logon-summary -f Security.evtx - Enregistrer les résultats du résumé des connexions :
hayabusa.exe logon-summary -d ../logs -o logon-summary.csv
Captures d'écran de logon-summary
Commande pivot-keywords-list
Vous pouvez utiliser la commande pivot-keywords-list pour créer une liste de mots-clés pivots uniques afin d'identifier rapidement les utilisateurs, noms d'hôtes, processus, etc. anormaux, ainsi que pour corréler les événements.
Important : par défaut, hayabusa renverra les résultats de tous les événements (informationnels et supérieurs), nous recommandons donc fortement de combiner la commande pivot-keywords-list avec l'option -m, --min-level.
Par exemple, commencez par créer des mots-clés uniquement à partir des alertes critical avec -m critical, puis continuez avec -m high, -m medium, etc.
Il y aura très probablement des mots-clés communs dans vos résultats qui correspondront à de nombreux événements normaux, donc après avoir vérifié manuellement les résultats et créé une liste de mots-clés uniques dans un seul fichier, vous pourrez ensuite créer une chronologie restreinte de l'activité suspecte avec une commande comme grep -f keywords.txt timeline.csv.
Usage: pivot-keywords-list <INPUT> [OPTIONS]

Input:
  -d, --directory <DIR>  Directory of multiple .evtx files
  -f, --file <FILE>      File path to one .evtx file
  -l, --live-analysis    Analyze the local C:\Windows\System32\winevt\Logs folder

General Options:
  -C, --clobber                        Overwrite files when saving
  -h, --help                           Show the help menu
  -J, --JSON-input                     Scan JSON formatted logs instead of .evtx (.json or .jsonl)
  -w, --no-wizard                      Do not ask questions. Scan for all events and alerts
  -Q, --quiet-errors                   Quiet errors mode: do not save error logs
  -x, --recover-records                Carve evtx records from slack space (default: disabled)
  -c, --rules-config <DIR>             Specify custom rule config directory (default: ./rules/config)
  -t, --threads <NUMBER>               Number of threads (default: optimal number for performance)
      --target-file-ext <FILE-EXT...>  Specify additional evtx file extensions (ex: evtx_data)

Filtering:
  -E, --EID-filter                      Scan only common EIDs for faster speed (./rules/config/target_event_IDs.txt)
  -D, --enable-deprecated-rules         Enable rules with a status of deprecated
  -n, --enable-noisy-rules              Enable rules set to noisy (./rules/config/noisy_rules.txt)
  -u, --enable-unsupported-rules        Enable rules with a status of unsupported
  -e, --exact-level <LEVEL>             Only load rules with a specific level (informational, low, medium, high, critical)
      --exclude-computer <COMPUTER...>  Do not scan specified computer names (ex: ComputerA) (ex: ComputerA,ComputerB)
      --exclude-eid <EID...>            Do not scan specific EIDs for faster speed (ex: 1) (ex: 1,4688)
      --exclude-status <STATUS...>      Do not load rules according to status (ex: experimental) (ex: stable,test)
      --exclude-tag <TAG...>            Do not load rules with specific tags (ex: sysmon)
      --include-computer <COMPUTER...>  Scan only specified computer names (ex: ComputerA) (ex: ComputerA,ComputerB)
      --include-eid <EID...>            Scan only specified EIDs for faster speed (ex: 1) (ex: 1,4688)
      --include-status <STATUS...>      Only load rules with specific status (ex: experimental) (ex: stable,test)
      --include-tag <TAG...>            Only load rules with specific tags (ex: attack.execution,attack.discovery)
  -m, --min-level <LEVEL>               Minimum level for rules to load (default: informational)
      --time-offset <OFFSET>            Scan recent events based on an offset (ex: 1y, 3M, 30d, 24h, 30m)
      --timeline-end <DATE>             End time of the event logs to load (ex: "2022-02-22 23:59:59 +09:00")
      --timeline-start <DATE>           Start time of the event logs to load (ex: "2020-02-22 00:00:00 +09:00")

Output:
  -o, --output <FILENAME-PREFIX>  Save pivot words to separate files (ex: PivotKeywords)

Display Settings:
  -K, --no-color  Disable color output
  -q, --quiet     Quiet mode: do not display the launch banner
  -v, --verbose   Output verbose information
Exemples de la commande pivot-keywords-list
- Afficher les mots-clés pivots à l'écran :
hayabusa.exe pivot-keywords-list -d ../logs -m critical - Créer une liste de mots-clés pivots à partir des alertes critiques et enregistrer les résultats. (Les résultats seront enregistrés dans
keywords-Ip Addresses.txt,keywords-Users.txt, etc.) :
Fichier de configuration de pivot-keywords-list
Vous pouvez personnaliser les mots-clés que vous souhaitez rechercher en modifiant ./rules/config/pivot_keywords.txt.
Cette page correspond au paramétrage par défaut.
Le format est KeywordName.FieldName. Par exemple, lors de la création de la liste des Users, hayabusa listera toutes les valeurs des champs SubjectUserName, TargetUserName et User.
Commande search
La commande search vous permet d'effectuer une recherche par mot-clé sur tous les événements.
(Pas seulement sur les résultats de détection de Hayabusa.)
Ceci est utile pour déterminer s'il existe des preuves dans des événements qui ne sont pas détectés par Hayabusa.
Usage: hayabusa.exe search <INPUT> <--keywords "<KEYWORDS>" OR --regex "<REGEX>"> [OPTIONS]

Display Settings:
  -K, --no-color  Disable color output
  -q, --quiet     Quiet mode: do not display the launch banner
  -v, --verbose   Output verbose information

General Options:
  -C, --clobber                        Overwrite files when saving
  -h, --help                           Show the help menu
  -Q, --quiet-errors                   Quiet errors mode: do not save error logs
  -x, --recover-records                Carve evtx records from slack space (default: disabled)
  -c, --rules-config <DIR>             Specify custom rule config directory (default: ./rules/config)
  -t, --threads <NUMBER>               Number of threads (default: optimal number for performance)
      --target-file-ext <FILE-EXT...>  Specify additional evtx file extensions (ex: evtx_data)
  -s, --sort                           Sort results before saving the file (warning: this uses much more memory!)

Input:
  -d, --directory <DIR>  Directory of multiple .evtx files
  -f, --file <FILE>      File path to one .evtx file
  -l, --live-analysis    Analyze the local C:\Windows\System32\winevt\Logs folder

Filtering:
  -a, --and-logic              Search keywords with AND logic (default: OR)
  -F, --filter <FILTER...>     Filter by specific field(s)
  -i, --ignore-case            Case-insensitive keyword search
  -k, --keyword <KEYWORD...>   Search by keyword(s)
  -r, --regex <REGEX>          Search by regular expression
      --time-offset <OFFSET>   Scan recent events based on an offset (ex: 1y, 3M, 30d, 24h, 30m)
      --timeline-end <DATE>    End time of the event logs to load (ex: "2022-02-22 23:59:59 +09:00")
      --timeline-start <DATE>  Start time of the event logs to load (ex: "2020-02-22 00:00:00 +09:00")

Output:
  -b, --disable-abbreviations  Disable abbreviations
  -J, --JSON-output            Save the search results in JSON format (ex: -J -o results.json)
  -L, --JSONL-output           Save the search results in JSONL format (ex: -L -o results.jsonl)
  -M, --multiline              Output event field information in multiple rows for CSV output
  -o, --output <FILE>          Save the search results in CSV format (ex: search.csv)
  -S, --tab-separator          Separate event field information by tabs

Time Format:
      --European-time     Output timestamp in European time format (ex: 22-02-2022 22:00:00.123 +02:00)
  -O, --ISO-8601          Output timestamp in original ISO-8601 format (ex: 2022-02-22T10:10:10.1234567Z) (Always UTC)
      --RFC-2822          Output timestamp in RFC 2822 format (ex: Fri, 22 Feb 2022 22:00:00 -0600)
      --RFC-3339          Output timestamp in RFC 3339 format (ex: 2022-02-22 22:00:00.123456-06:00)
      --US-military-time  Output timestamp in US military time format (ex: 02-22-2022 22:00:00.123 -06:00)
      --US-time           Output timestamp in US time format (ex: 02-22-2022 10:00:00.123 PM -06:00)
  -U, --UTC               Output time in UTC format (default: local time)
Exemples de la commande search
- Rechercher le mot-clé
mimikatzdans le répertoire../hayabusa-sample-evtx:
Note : Le mot-clé correspondra si
mimikatzest trouvé n'importe où dans les données. Ce n'est pas une correspondance exacte.
- Rechercher les mots-clés
mimikatzoukalidans le répertoire../hayabusa-sample-evtx:
- Rechercher le mot-clé
mimikatzdans le répertoire../hayabusa-sample-evtxen ignorant la casse :
- Rechercher les adresses IP dans le répertoire
../hayabusa-sample-evtxà l'aide d'expressions régulières :
- Rechercher dans le répertoire
../hayabusa-sample-evtxet afficher tous les événements où le champWorkstationNameestkali:
Note :
.*est l'expression régulière qui correspond à chaque événement.
Fichiers de configuration de la commande search
./rules/config/channel_abbreviations.txt : Correspondances entre les noms de canaux et leurs abréviations.