Команди аналізу
Команда computer-metrics
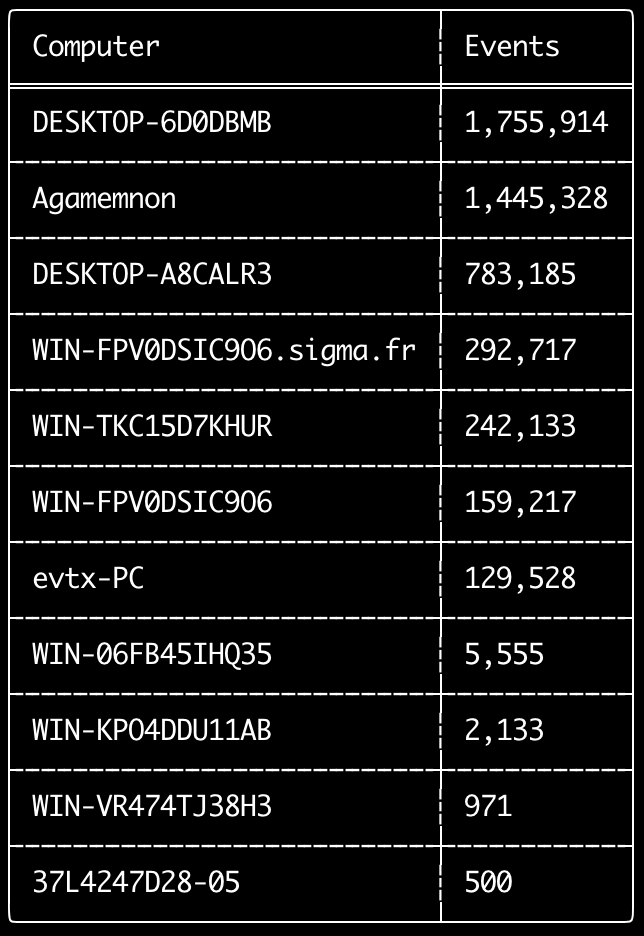
Ви можете використовувати команду computer-metrics, щоб перевірити, скільки подій припадає на кожен комп'ютер, визначений у полі <System><Computer>.
Майте на увазі, що не можна повністю покладатися на поле Computer для розділення подій за їхнім початковим комп'ютером.
Windows 11 іноді використовує зовсім інші імена Computer під час збереження в журналах подій.
Крім того, Windows 10 іноді записує ім'я Computer повністю малими літерами.
Ця команда не використовує жодних правил виявлення, тому аналізуватиме всі події.
Це гарна команда для швидкого перегляду того, які комп'ютери мають найбільше журналів.
З цією інформацією ви потім можете використовувати опції --include-computer або --exclude-computer під час створення своїх часових шкал, щоб зробити генерацію часових шкал ефективнішою, створюючи декілька часових шкал відповідно до комп'ютера або виключаючи події з певних комп'ютерів.
Usage: computer-metrics <INPUT> [OPTIONS]

Input:
  -d, --directory <DIR>  Directory of multiple .evtx files
  -f, --file <FILE>      File path to one .evtx file
  -l, --live-analysis    Analyze the local C:\Windows\System32\winevt\Logs folder

General Options:
  -C, --clobber                        Overwrite files when saving
  -h, --help                           Show the help menu
  -J, --JSON-input                     Scan JSON formatted logs instead of .evtx (.json or .jsonl)
  -Q, --quiet-errors                   Quiet errors mode: do not save error logs
  -x, --recover-records                Carve evtx records from slack space (default: disabled)
  -c, --rules-config <DIR>             Specify custom rule config directory (default: ./rules/config)
      --target-file-ext <FILE-EXT...>  Specify additional evtx file extensions (ex: evtx_data)
  -t, --threads <NUMBER>               Number of threads (default: optimal number for performance)

Filtering:
      --time-offset <OFFSET>  Scan recent events based on an offset (ex: 1y, 3M, 30d, 24h, 30m)

Output:
  -o, --output <FILE>  Save the results in CSV format (ex: computer-metrics.csv)

Display Settings:
  -K, --no-color  Disable color output
  -q, --quiet     Quiet mode: do not display the launch banner
  -v, --verbose   Output verbose information
Приклади команди computer-metrics
- Вивести метрики імен комп'ютерів з каталогу:
hayabusa.exe computer-metrics -d ../logs - Зберегти результати у файл CSV:
hayabusa.exe computer-metrics -d ../logs -o computer-metrics.csv
Знімок екрана computer-metrics
Команда eid-metrics
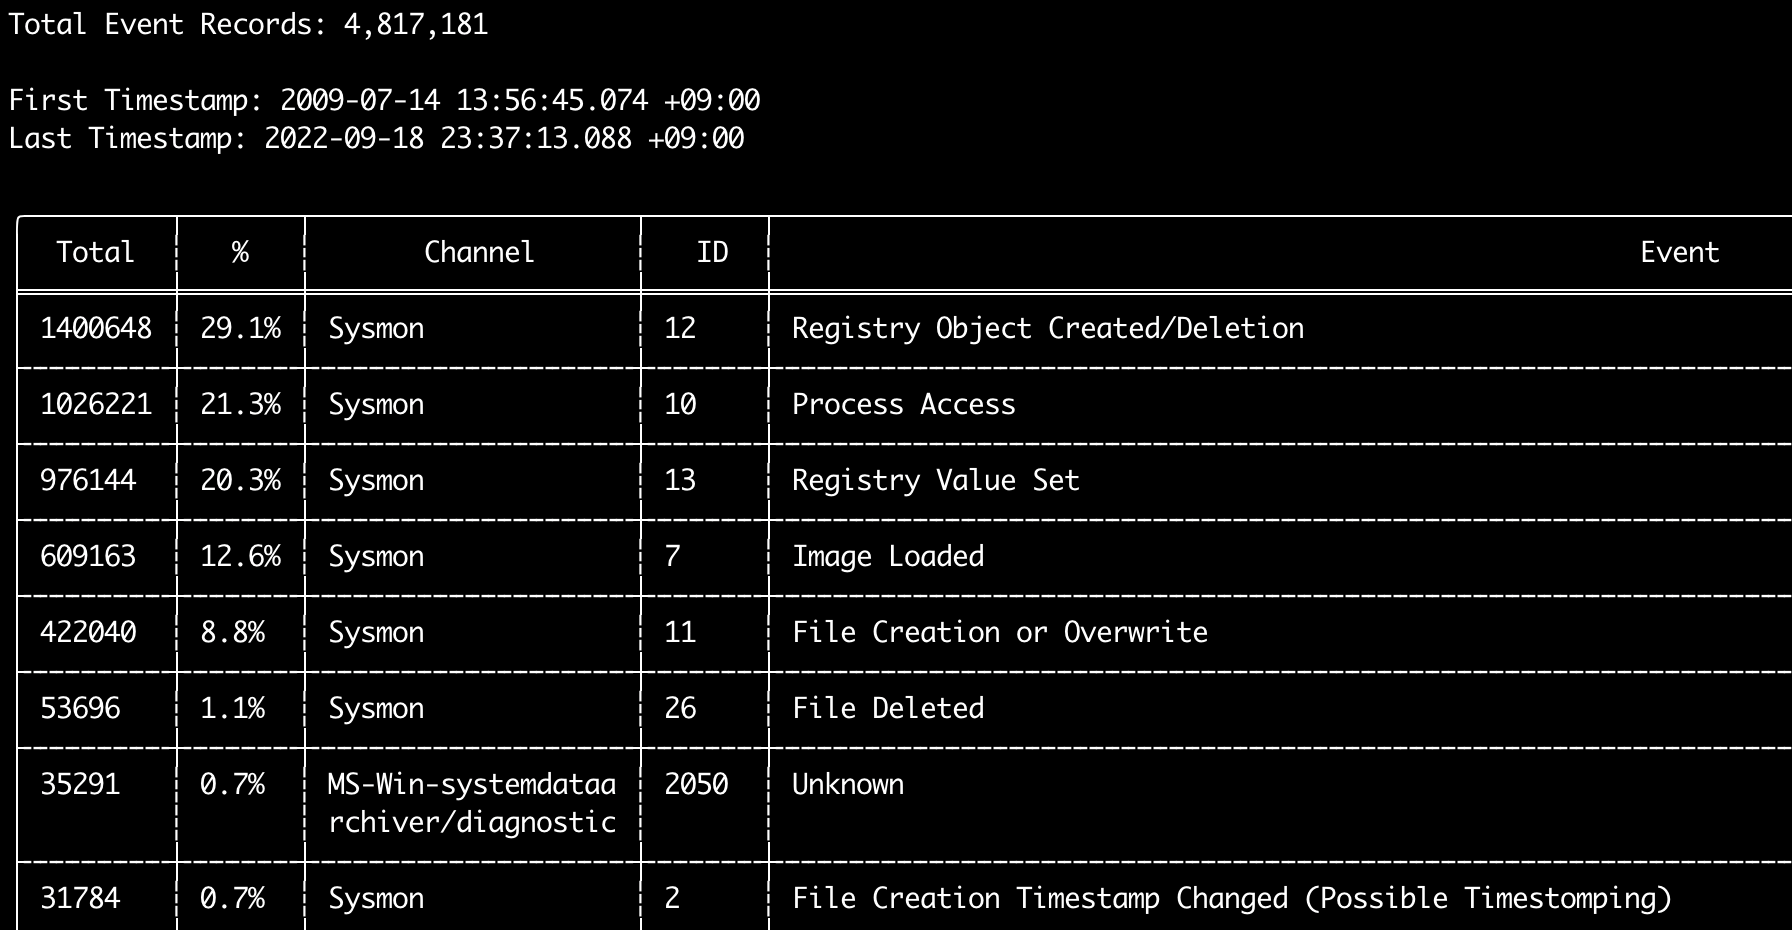
Ви можете використовувати команду eid-metrics, щоб вивести загальну кількість та відсоток ідентифікаторів подій (поле <System><EventID>), розділених за каналами.
Ця команда не використовує жодних правил виявлення, тому скануватиме всі події.
Usage: eid-metrics <INPUT> [OPTIONS]

Input:
  -d, --directory <DIR>  Directory of multiple .evtx files
  -f, --file <FILE>      File path to one .evtx file
  -l, --live-analysis    Analyze the local C:\Windows\System32\winevt\Logs folder

General Options:
  -C, --clobber                        Overwrite files when saving
  -h, --help                           Show the help menu
  -J, --JSON-input                     Scan JSON formatted logs instead of .evtx (.json or .jsonl)
  -Q, --quiet-errors                   Quiet errors mode: do not save error logs
  -x, --recover-records                Carve evtx records from slack space (default: disabled)
  -c, --rules-config <DIR>             Specify custom rule config directory (default: ./rules/config)
  -t, --threads <NUMBER>               Number of threads (default: optimal number for performance)
      --target-file-ext <FILE-EXT...>  Specify additional evtx file extensions (ex: evtx_data)

Filtering:
      --exclude-computer <COMPUTER...>  Do not scan specified computer names (ex: ComputerA) (ex: ComputerA,ComputerB)
      --include-computer <COMPUTER...>  Scan only specified computer names (ex: ComputerA) (ex: ComputerA,ComputerB)
      --time-offset <OFFSET>            Scan recent events based on an offset (ex: 1y, 3M, 30d, 24h, 30m)

Output:
  -b, --disable-abbreviations  Disable abbreviations
  -o, --output <FILE>          Save the Metrics in CSV format (ex: metrics.csv)

Display Settings:
  -K, --no-color  Disable color output
  -q, --quiet     Quiet mode: do not display the launch banner
  -v, --verbose   Output verbose information

Time Format:
      --European-time     Output timestamp in European time format (ex: 22-02-2022 22:00:00.123 +02:00)
  -O, --ISO-8601          Output timestamp in original ISO-8601 format (ex: 2022-02-22T10:10:10.1234567Z) (Always UTC)
      --RFC-2822          Output timestamp in RFC 2822 format (ex: Fri, 22 Feb 2022 22:00:00 -0600)
      --RFC-3339          Output timestamp in RFC 3339 format (ex: 2022-02-22 22:00:00.123456-06:00)
      --US-military-time  Output timestamp in US military time format (ex: 02-22-2022 22:00:00.123 -06:00)
      --US-time           Output timestamp in US time format (ex: 02-22-2022 10:00:00.123 PM -06:00)
  -U, --UTC               Output time in UTC format (default: local time)
Приклади команди eid-metrics
- Вивести метрики Event ID з одного файлу:
hayabusa.exe eid-metrics -f Security.evtx - Вивести метрики Event ID з каталогу:
hayabusa.exe eid-metrics -d ../logs - Зберегти результати у файл CSV:
hayabusa.exe eid-metrics -f Security.evtx -o eid-metrics.csv
Файл конфігурації команди eid-metrics
Канал, ідентифікатори подій та заголовки подій визначені у rules/config/channel_eid_info.txt.
Приклад:
Channel,EventID,EventTitle
Microsoft-Windows-Sysmon/Operational,1,Process Creation.
Microsoft-Windows-Sysmon/Operational,2,File Creation Timestamp Changed. (Possible Timestomping)
Microsoft-Windows-Sysmon/Operational,3,Network Connection.
Microsoft-Windows-Sysmon/Operational,4,Sysmon Service State Changed.
Знімок екрана eid-metrics
Команда expand-list
Витягти заповнювачі expand з папки правил.
Це корисно під час створення конфігураційних файлів для використання будь-якого правила, що використовує модифікатор поля expand.
Щоб використовувати правила expand, вам просто потрібно створити файл .txt з ім'ям модифікатора поля expand у каталозі ./config/expand/ і помістити в файл усі значення, які ви хочете перевірити.
Наприклад, якщо логіка detection правила така:
detection:
    selection:
        EventID: 5145
        RelativeTargetName|contains: '\winreg'
    filter_main:
        IpAddress|expand: '%Admins_Workstations%'
    condition: selection and not filter_main
ви створили б текстовий файл ./config/expand/Admins_Workstations.txt і помістили б у нього значення на кшталт:
Це по суті перевіряло б ту саму логіку, що й:
Якщо конфігураційний файл не існує, Hayabusa все одно завантажить правило expand, але проігнорує його.
Usage:  expand-list <INPUT> [OPTIONS]

General Options:
  -h, --help              Show the help menu
  -r, --rules <DIR/FILE>  Specify rule directory (default: ./rules)

Display Settings:
  -K, --no-color  Disable color output
  -q, --quiet     Quiet mode: do not display the launch banner
Приклади команди expand-list
- Витягти модифікатори поля
expandзі стандартного каталогуrules:hayabusa.exe expand-list - Витягти модифікатори поля
expandз каталогуsigma:hayabusa.exe eid-metrics -r ../sigma
Результати expand-list
5 unique expand placeholders found:
Admins_Workstations
DC-MACHINE-NAME
Workstations
internal_domains
domain_controller_hostnames
Команда extract-base64
Ця команда витягуватиме рядки base64 з наступних подій, декодуватиме їх та повідомлятиме, який тип кодування використовується. * Security 4688 CommandLine * Sysmon 1 CommandLine, ParentCommandLine * System 7045 ImagePath * PowerShell Operational 4104 * PowerShell Operational 4103
Usage:  extract-base64 <INPUT> [OPTIONS]

Input:
  -d, --directory <DIR>  Directory of multiple .evtx files
  -f, --file <FILE>      File path to one .evtx file
  -l, --live-analysis    Analyze the local C:\Windows\System32\winevt\Logs folder

General Options:
  -C, --clobber                        Overwrite files when saving
  -h, --help                           Show the help menu
  -J, --JSON-input                     Scan JSON formatted logs instead of .evtx (.json or .jsonl)
  -Q, --quiet-errors                   Quiet errors mode: do not save error logs
  -x, --recover-records                Carve evtx records from slack space (default: disabled)
  -c, --rules-config <DIR>             Specify custom rule config directory (default: ./rules/config)
  -t, --threads <NUMBER>               Number of threads (default: optimal number for performance)
      --target-file-ext <FILE-EXT...>  Specify additional evtx file extensions (ex: evtx_data)

Filtering:
      --exclude-computer <COMPUTER...>  Do not scan specified computer names (ex: ComputerA) (ex: ComputerA,ComputerB)
      --include-computer <COMPUTER...>  Scan only specified computer names (ex: ComputerA) (ex: ComputerA,ComputerB)
      --time-offset <OFFSET>            Scan recent events based on an offset (ex: 1y, 3M, 30d, 24h, 30m)

Output:
  -o, --output <FILE>  Extract Base64 strings

Display Settings:
  -K, --no-color  Disable color output
  -q, --quiet     Quiet mode: do not display the launch banner
  -v, --verbose   Output verbose information

Time Format:
      --European-time     Output timestamp in European time format (ex: 22-02-2022 22:00:00.123 +02:00)
  -O, --ISO-8601          Output timestamp in original ISO-8601 format (ex: 2022-02-22T10:10:10.1234567Z) (Always UTC)
      --RFC-2822          Output timestamp in RFC 2822 format (ex: Fri, 22 Feb 2022 22:00:00 -0600)
      --RFC-3339          Output timestamp in RFC 3339 format (ex: 2022-02-22 22:00:00.123456-06:00)
      --US-military-time  Output timestamp in US military time format (ex: 02-22-2022 22:00:00.123 -06:00)
      --US-time           Output timestamp in US time format (ex: 02-22-2022 10:00:00.123 PM -06:00)
  -U, --UTC               Output time in UTC format (default: local time)
Приклади команди extract-base64
- Сканувати каталог і вивести в термінал:
hayabusa.exe extract-base64 -d ../hayabusa-sample-evtx - Сканувати каталог і вивести у файл CSV:
hayabusa.exe eid-metrics -r ../sigma -o base64-extracted.csv
Результати extract-base64
Під час виведення в термінал, оскільки простір обмежений, відображаються лише наступні поля: * Timestamp * Computer * Base64 String * Decoded String (if not binary)
Під час збереження у файл CSV зберігаються наступні поля:
* Timestamp
* Computer
* Base64 String
* Decoded String (if not binary)
* Original Field
* Length
* Binary (Y/N)
* Double Encoding (when Y, it usually is malicious)
* Encoding Type
* File Type
* Event
* Record ID
* File Name
Команда log-metrics
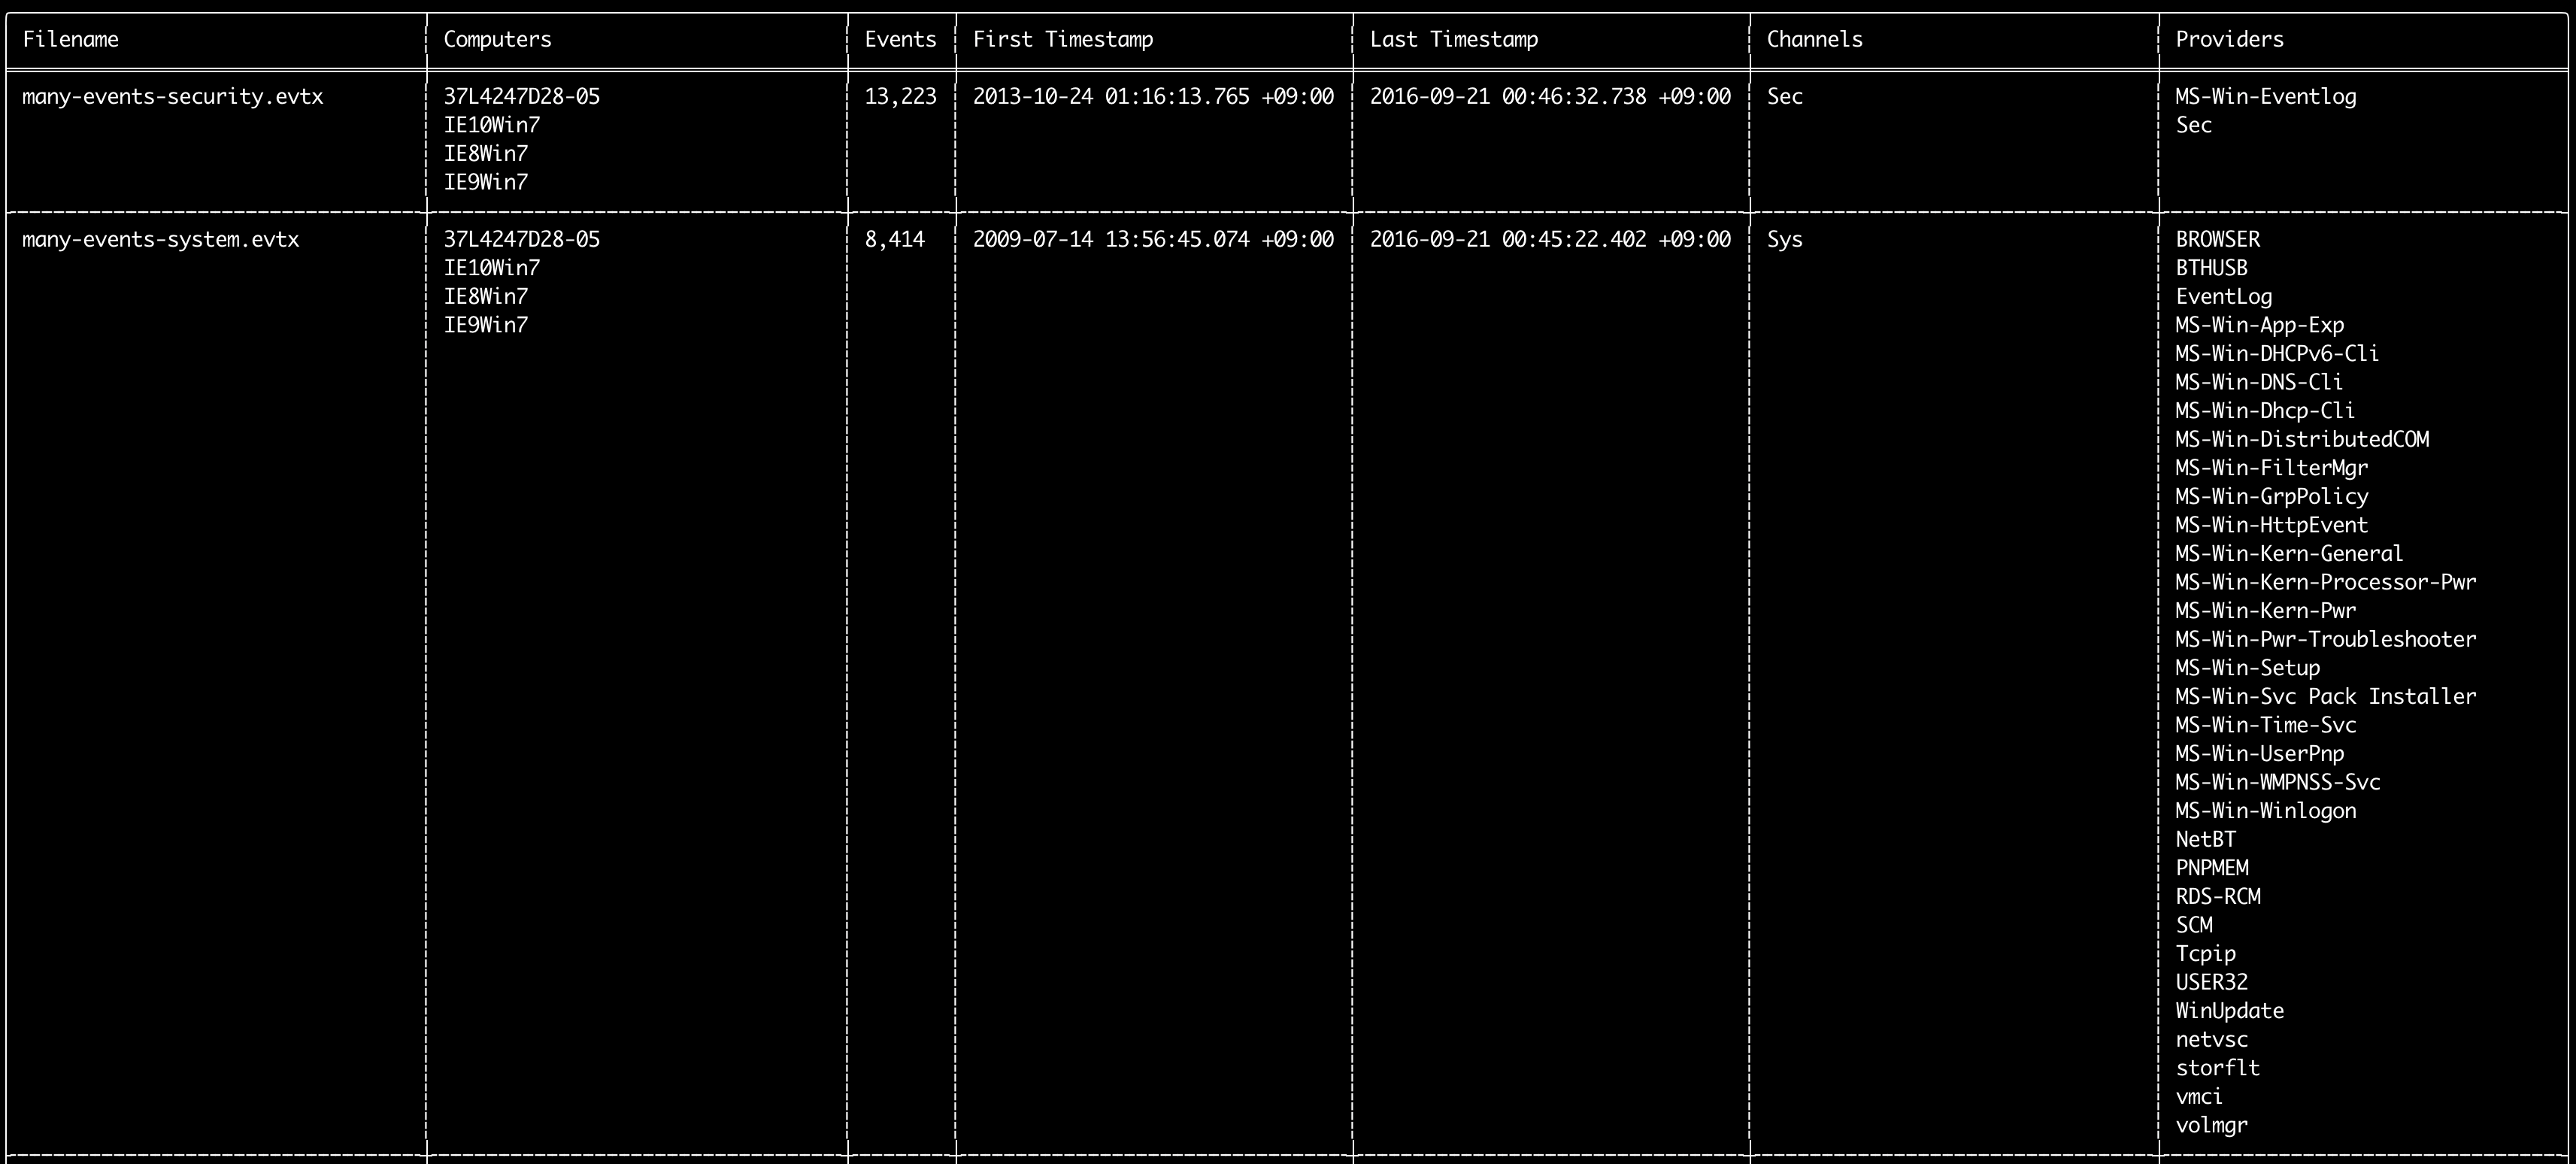
Ви можете використовувати команду log-metrics, щоб вивести наступні метадані всередині журналів подій:
* Filename
* Computer names
* Number of events
* First timestamp
* Last timestamp
* Channels
* Providers
Ця команда не використовує жодних правил виявлення, тому скануватиме всі події.
Usage: log-metrics <INPUT> [OPTIONS]

Input:
  -d, --directory <DIR>  Directory of multiple .evtx files
  -f, --file <FILE>      File path to one .evtx file
  -l, --live-analysis    Analyze the local C:\Windows\System32\winevt\Logs folder

General Options:
  -C, --clobber                        Overwrite files when saving
  -h, --help                           Show the help menu
  -J, --JSON-input                     Scan JSON formatted logs instead of .evtx (.json or .jsonl)
  -Q, --quiet-errors                   Quiet errors mode: do not save error logs
  -x, --recover-records                Carve evtx records from slack space (default: disabled)
  -c, --rules-config <DIR>             Specify custom rule config directory (default: ./rules/config)
  -t, --threads <NUMBER>               Number of threads (default: optimal number for performance)
      --target-file-ext <FILE-EXT...>  Specify additional evtx file extensions (ex: evtx_data)

Filtering:
      --exclude-computer <COMPUTER...>  Do not scan specified computer names (ex: ComputerA) (ex: ComputerA,ComputerB)
      --include-computer <COMPUTER...>  Scan only specified computer names (ex: ComputerA) (ex: ComputerA,ComputerB)
      --time-offset <OFFSET>            Scan recent events based on an offset (ex: 1y, 3M, 30d, 24h, 30m)

Output:
  -b, --disable-abbreviations  Disable abbreviations
  -M, --multiline              Output event field information in multiple rows for CSV output
  -o, --output <FILE>          Save the Metrics in CSV format (ex: metrics.csv)
  -S, --tab-separator          Separate event field information by tabs

Display Settings:
  -K, --no-color  Disable color output
  -q, --quiet     Quiet mode: do not display the launch banner
  -v, --verbose   Output verbose information

Time Format:
      --European-time     Output timestamp in European time format (ex: 22-02-2022 22:00:00.123 +02:00)
  -O, --ISO-8601          Output timestamp in original ISO-8601 format (ex: 2022-02-22T10:10:10.1234567Z) (Always UTC)
      --RFC-2822          Output timestamp in RFC 2822 format (ex: Fri, 22 Feb 2022 22:00:00 -0600)
      --RFC-3339          Output timestamp in RFC 3339 format (ex: 2022-02-22 22:00:00.123456-06:00)
      --US-military-time  Output timestamp in US military time format (ex: 02-22-2022 22:00:00.123 -06:00)
      --US-time           Output timestamp in US time format (ex: 02-22-2022 10:00:00.123 PM -06:00)
  -U, --UTC               Output time in UTC format (default: local time)
Приклади команди log-metrics
- Вивести метрики Event ID з одного файлу:
hayabusa.exe log-metrics -f Security.evtx - Вивести метрики Event ID з каталогу:
hayabusa.exe log-metrics -d ../logs - Зберегти результати у файл CSV:
hayabusa.exe log-metrics -d ../logs -o eid-metrics.csv
Знімок екрана log-metrics
Команда logon-summary
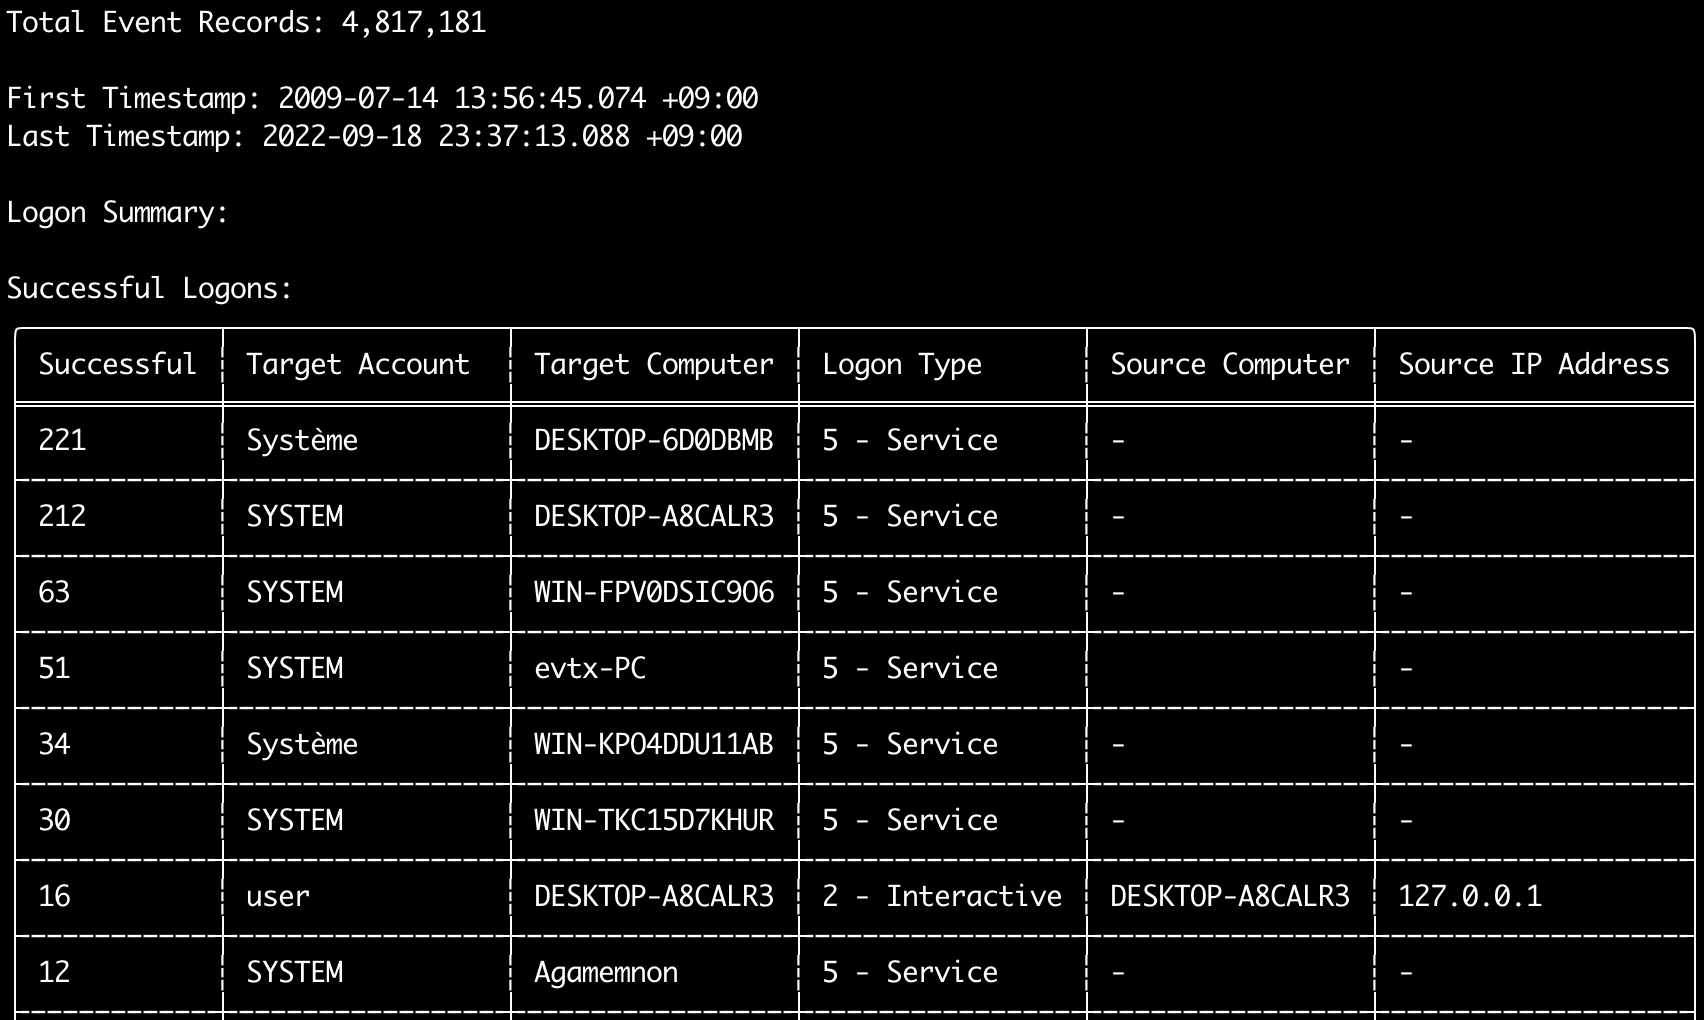
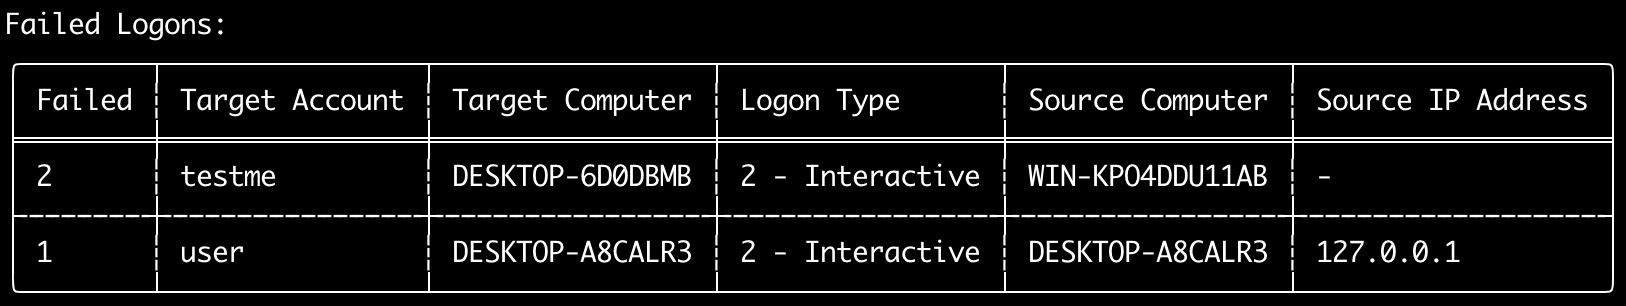
Ви можете використовувати команду logon-summary, щоб вивести зведення інформації про входи (імена користувачів, що входили в систему, а також кількість успішних і невдалих входів).
Ви можете відобразити інформацію про входи для одного файлу evtx за допомогою -f або для кількох файлів evtx за допомогою опції -d.
Успішні входи беруться з наступних подій:
* Security 4624 (Successful Logon)
* RDS-LSM 21 (Remote Desktop Service Local Session Manager Logon)
* RDS-GTW 302 (Remote Desktop Service Gateway Logon)
Невдалі входи беруться з подій Security 4625.
Usage: logon-summary <INPUT> [OPTIONS]

Input:
  -d, --directory <DIR>  Directory of multiple .evtx files
  -f, --file <FILE>      File path to one .evtx file
  -l, --live-analysis    Analyze the local C:\Windows\System32\winevt\Logs folder

General Options:
  -C, --clobber                        Overwrite files when saving
  -h, --help                           Show the help menu
  -J, --JSON-input                     Scan JSON formatted logs instead of .evtx (.json or .jsonl)
  -Q, --quiet-errors                   Quiet errors mode: do not save error logs
  -x, --recover-records                Carve evtx records from slack space (default: disabled)
  -c, --rules-config <DIR>             Specify custom rule config directory (default: ./rules/config)
  -t, --threads <NUMBER>               Number of threads (default: optimal number for performance)
      --target-file-ext <FILE-EXT...>  Specify additional evtx file extensions (ex: evtx_data)

Filtering:
      --exclude-computer <COMPUTER...>  Do not scan specified computer names (ex: ComputerA) (ex: ComputerA,ComputerB)
      --include-computer <COMPUTER...>  Scan only specified computer names (ex: ComputerA) (ex: ComputerA,ComputerB)
      --time-offset <OFFSET>            Scan recent events based on an offset (ex: 1y, 3M, 30d, 24h, 30m)
      --timeline-end <DATE>             End time of the event logs to load (ex: "2022-02-22 23:59:59 +09:00")
      --timeline-start <DATE>           Start time of the event logs to load (ex: "2020-02-22 00:00:00 +09:00")

Output:
  -o, --output <FILENAME-PREFIX>  Save the logon summary to two CSV files (ex: -o logon-summary)

Display Settings:
  -K, --no-color  Disable color output
  -q, --quiet     Quiet mode: do not display the launch banner
  -v, --verbose   Output verbose information

Time Format:
      --European-time     Output timestamp in European time format (ex: 22-02-2022 22:00:00.123 +02:00)
  -O, --ISO-8601          Output timestamp in original ISO-8601 format (ex: 2022-02-22T10:10:10.1234567Z) (Always UTC)
      --RFC-2822          Output timestamp in RFC 2822 format (ex: Fri, 22 Feb 2022 22:00:00 -0600)
      --RFC-3339          Output timestamp in RFC 3339 format (ex: 2022-02-22 22:00:00.123456-06:00)
      --US-military-time  Output timestamp in US military time format (ex: 02-22-2022 22:00:00.123 -06:00)
      --US-time           Output timestamp in US time format (ex: 02-22-2022 10:00:00.123 PM -06:00)
  -U, --UTC               Output time in UTC format (default: local time)
Приклади команди logon-summary
- Вивести зведення входів:
hayabusa.exe logon-summary -f Security.evtx - Зберегти результати зведення входів:
hayabusa.exe logon-summary -d ../logs -o logon-summary.csv
Знімки екрана logon-summary
Команда pivot-keywords-list
Ви можете використовувати команду pivot-keywords-list, щоб створити список унікальних опорних ключових слів для швидкої ідентифікації аномальних користувачів, імен хостів, процесів тощо, а також для кореляції подій.
Важливо: за замовчуванням hayabusa повертатиме результати з усіх подій (інформаційних і вище), тому ми наполегливо рекомендуємо поєднувати команду pivot-keywords-list з опцією -m, --min-level.
Наприклад, почніть лише зі створення ключових слів зі сповіщень critical за допомогою -m critical, а потім продовжіть з -m high, -m medium тощо.
У ваших результатах, найімовірніше, будуть поширені ключові слова, що збігатимуться з багатьма звичайними подіями, тому після ручної перевірки результатів і створення списку унікальних ключових слів в одному файлі, ви потім можете створити звужену часову шкалу підозрілої активності за допомогою команди на кшталт grep -f keywords.txt timeline.csv.
Usage: pivot-keywords-list <INPUT> [OPTIONS]

Input:
  -d, --directory <DIR>  Directory of multiple .evtx files
  -f, --file <FILE>      File path to one .evtx file
  -l, --live-analysis    Analyze the local C:\Windows\System32\winevt\Logs folder

General Options:
  -C, --clobber                        Overwrite files when saving
  -h, --help                           Show the help menu
  -J, --JSON-input                     Scan JSON formatted logs instead of .evtx (.json or .jsonl)
  -w, --no-wizard                      Do not ask questions. Scan for all events and alerts
  -Q, --quiet-errors                   Quiet errors mode: do not save error logs
  -x, --recover-records                Carve evtx records from slack space (default: disabled)
  -c, --rules-config <DIR>             Specify custom rule config directory (default: ./rules/config)
  -t, --threads <NUMBER>               Number of threads (default: optimal number for performance)
      --target-file-ext <FILE-EXT...>  Specify additional evtx file extensions (ex: evtx_data)

Filtering:
  -E, --EID-filter                      Scan only common EIDs for faster speed (./rules/config/target_event_IDs.txt)
  -D, --enable-deprecated-rules         Enable rules with a status of deprecated
  -n, --enable-noisy-rules              Enable rules set to noisy (./rules/config/noisy_rules.txt)
  -u, --enable-unsupported-rules        Enable rules with a status of unsupported
  -e, --exact-level <LEVEL>             Only load rules with a specific level (informational, low, medium, high, critical)
      --exclude-computer <COMPUTER...>  Do not scan specified computer names (ex: ComputerA) (ex: ComputerA,ComputerB)
      --exclude-eid <EID...>            Do not scan specific EIDs for faster speed (ex: 1) (ex: 1,4688)
      --exclude-status <STATUS...>      Do not load rules according to status (ex: experimental) (ex: stable,test)
      --exclude-tag <TAG...>            Do not load rules with specific tags (ex: sysmon)
      --include-computer <COMPUTER...>  Scan only specified computer names (ex: ComputerA) (ex: ComputerA,ComputerB)
      --include-eid <EID...>            Scan only specified EIDs for faster speed (ex: 1) (ex: 1,4688)
      --include-status <STATUS...>      Only load rules with specific status (ex: experimental) (ex: stable,test)
      --include-tag <TAG...>            Only load rules with specific tags (ex: attack.execution,attack.discovery)
  -m, --min-level <LEVEL>               Minimum level for rules to load (default: informational)
      --time-offset <OFFSET>            Scan recent events based on an offset (ex: 1y, 3M, 30d, 24h, 30m)
      --timeline-end <DATE>             End time of the event logs to load (ex: "2022-02-22 23:59:59 +09:00")
      --timeline-start <DATE>           Start time of the event logs to load (ex: "2020-02-22 00:00:00 +09:00")

Output:
  -o, --output <FILENAME-PREFIX>  Save pivot words to separate files (ex: PivotKeywords)

Display Settings:
  -K, --no-color  Disable color output
  -q, --quiet     Quiet mode: do not display the launch banner
  -v, --verbose   Output verbose information
Приклади команди pivot-keywords-list
- Вивести опорні ключові слова на екран:
hayabusa.exe pivot-keywords-list -d ../logs -m critical - Створити список опорних ключових слів зі сповіщень рівня critical і зберегти результати. (Результати будуть збережені в
keywords-Ip Addresses.txt,keywords-Users.txtтощо):
Файл конфігурації pivot-keywords-list
Ви можете налаштувати, які ключові слова ви хочете шукати, відредагувавши ./rules/config/pivot_keywords.txt.
Ця сторінка є стандартним налаштуванням.
Формат: KeywordName.FieldName. Наприклад, під час створення списку Users hayabusa перелічить усі значення в полях SubjectUserName, TargetUserName і User.
Команда search
Команда search дозволить вам виконувати пошук за ключовими словами в усіх подіях.
(Не лише в результатах виявлення Hayabusa.)
Це корисно для визначення того, чи є якісь докази в подіях, які не виявляються Hayabusa.
Usage: hayabusa.exe search <INPUT> <--keywords "<KEYWORDS>" OR --regex "<REGEX>"> [OPTIONS]

Display Settings:
  -K, --no-color  Disable color output
  -q, --quiet     Quiet mode: do not display the launch banner
  -v, --verbose   Output verbose information

General Options:
  -C, --clobber                        Overwrite files when saving
  -h, --help                           Show the help menu
  -Q, --quiet-errors                   Quiet errors mode: do not save error logs
  -x, --recover-records                Carve evtx records from slack space (default: disabled)
  -c, --rules-config <DIR>             Specify custom rule config directory (default: ./rules/config)
  -t, --threads <NUMBER>               Number of threads (default: optimal number for performance)
      --target-file-ext <FILE-EXT...>  Specify additional evtx file extensions (ex: evtx_data)
  -s, --sort                           Sort results before saving the file (warning: this uses much more memory!)

Input:
  -d, --directory <DIR>  Directory of multiple .evtx files
  -f, --file <FILE>      File path to one .evtx file
  -l, --live-analysis    Analyze the local C:\Windows\System32\winevt\Logs folder

Filtering:
  -a, --and-logic              Search keywords with AND logic (default: OR)
  -F, --filter <FILTER...>     Filter by specific field(s)
  -i, --ignore-case            Case-insensitive keyword search
  -k, --keyword <KEYWORD...>   Search by keyword(s)
  -r, --regex <REGEX>          Search by regular expression
      --time-offset <OFFSET>   Scan recent events based on an offset (ex: 1y, 3M, 30d, 24h, 30m)
      --timeline-end <DATE>    End time of the event logs to load (ex: "2022-02-22 23:59:59 +09:00")
      --timeline-start <DATE>  Start time of the event logs to load (ex: "2020-02-22 00:00:00 +09:00")

Output:
  -b, --disable-abbreviations  Disable abbreviations
  -J, --JSON-output            Save the search results in JSON format (ex: -J -o results.json)
  -L, --JSONL-output           Save the search results in JSONL format (ex: -L -o results.jsonl)
  -M, --multiline              Output event field information in multiple rows for CSV output
  -o, --output <FILE>          Save the search results in CSV format (ex: search.csv)
  -S, --tab-separator          Separate event field information by tabs

Time Format:
      --European-time     Output timestamp in European time format (ex: 22-02-2022 22:00:00.123 +02:00)
  -O, --ISO-8601          Output timestamp in original ISO-8601 format (ex: 2022-02-22T10:10:10.1234567Z) (Always UTC)
      --RFC-2822          Output timestamp in RFC 2822 format (ex: Fri, 22 Feb 2022 22:00:00 -0600)
      --RFC-3339          Output timestamp in RFC 3339 format (ex: 2022-02-22 22:00:00.123456-06:00)
      --US-military-time  Output timestamp in US military time format (ex: 02-22-2022 22:00:00.123 -06:00)
      --US-time           Output timestamp in US time format (ex: 02-22-2022 10:00:00.123 PM -06:00)
  -U, --UTC               Output time in UTC format (default: local time)
Приклади команди search
- Виконати пошук ключового слова
mimikatzу каталозі../hayabusa-sample-evtx:
Примітка: Ключове слово збіжиться, якщо
mimikatzзнайдено будь-де в даних. Це не точний збіг.
- Виконати пошук ключових слів
mimikatzабоkaliу каталозі../hayabusa-sample-evtx:
- Виконати пошук ключового слова
mimikatzу каталозі../hayabusa-sample-evtxбез урахування регістру:
- Виконати пошук IP-адрес у каталозі
../hayabusa-sample-evtxза допомогою регулярних виразів:
- Виконати пошук у каталозі
../hayabusa-sample-evtxі показати всі події, де полеWorkstationNameдорівнюєkali:
Примітка:
.*— це регулярний вираз для збігу з кожною подією.
Файли конфігурації команди search
./rules/config/channel_abbreviations.txt: Зіставлення імен каналів та їхніх скорочень.