คำสั่งวิเคราะห์ (Analysis Commands)
คำสั่ง computer-metrics
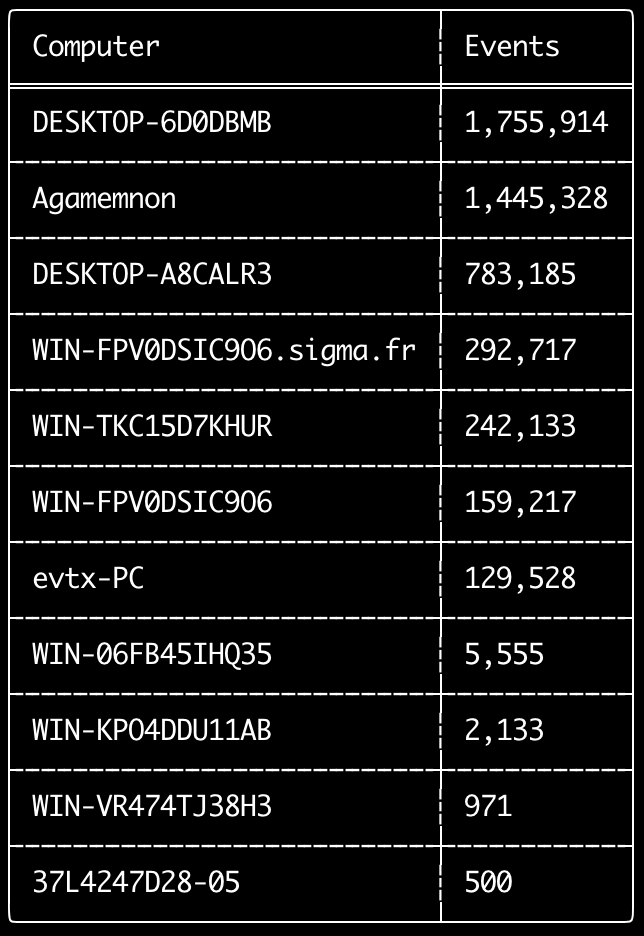
คุณสามารถใช้คำสั่ง computer-metrics เพื่อตรวจสอบว่ามีเหตุการณ์จำนวนเท่าใดตามแต่ละคอมพิวเตอร์ที่กำหนดไว้ในฟิลด์ <System><Computer>
โปรดทราบว่าคุณไม่สามารถพึ่งพาฟิลด์ Computer อย่างสมบูรณ์ในการแยกเหตุการณ์ตามคอมพิวเตอร์ต้นทางได้
Windows 11 บางครั้งจะใช้ชื่อ Computer ที่แตกต่างกันโดยสิ้นเชิงเมื่อบันทึกลงในบันทึกเหตุการณ์
นอกจากนี้ Windows 10 บางครั้งจะบันทึกชื่อ Computer เป็นตัวพิมพ์เล็กทั้งหมด
คำสั่งนี้ไม่ใช้กฎการตรวจจับใด ๆ จึงจะวิเคราะห์เหตุการณ์ทั้งหมด
นี่เป็นคำสั่งที่ดีในการรันเพื่อดูอย่างรวดเร็วว่าคอมพิวเตอร์ใดมีบันทึกมากที่สุด
ด้วยข้อมูลนี้ คุณจึงสามารถใช้ตัวเลือก --include-computer หรือ --exclude-computer เมื่อสร้างไทม์ไลน์ของคุณ เพื่อทำให้การสร้างไทม์ไลน์มีประสิทธิภาพมากขึ้นโดยการสร้างไทม์ไลน์หลายรายการตามคอมพิวเตอร์ หรือยกเว้นเหตุการณ์จากคอมพิวเตอร์บางเครื่อง
Usage: computer-metrics <INPUT> [OPTIONS]

Input:
  -d, --directory <DIR>  Directory of multiple .evtx files
  -f, --file <FILE>      File path to one .evtx file
  -l, --live-analysis    Analyze the local C:\Windows\System32\winevt\Logs folder

General Options:
  -C, --clobber                        Overwrite files when saving
  -h, --help                           Show the help menu
  -J, --JSON-input                     Scan JSON formatted logs instead of .evtx (.json or .jsonl)
  -Q, --quiet-errors                   Quiet errors mode: do not save error logs
  -x, --recover-records                Carve evtx records from slack space (default: disabled)
  -c, --rules-config <DIR>             Specify custom rule config directory (default: ./rules/config)
      --target-file-ext <FILE-EXT...>  Specify additional evtx file extensions (ex: evtx_data)
  -t, --threads <NUMBER>               Number of threads (default: optimal number for performance)

Filtering:
      --time-offset <OFFSET>  Scan recent events based on an offset (ex: 1y, 3M, 30d, 24h, 30m)

Output:
  -o, --output <FILE>  Save the results in CSV format (ex: computer-metrics.csv)

Display Settings:
  -K, --no-color  Disable color output
  -q, --quiet     Quiet mode: do not display the launch banner
  -v, --verbose   Output verbose information
ตัวอย่างคำสั่ง computer-metrics
- พิมพ์เมตริกชื่อคอมพิวเตอร์จากไดเรกทอรี:
hayabusa.exe computer-metrics -d ../logs - บันทึกผลลัพธ์ลงในไฟล์ CSV:
hayabusa.exe computer-metrics -d ../logs -o computer-metrics.csv
ภาพหน้าจอ computer-metrics
คำสั่ง eid-metrics
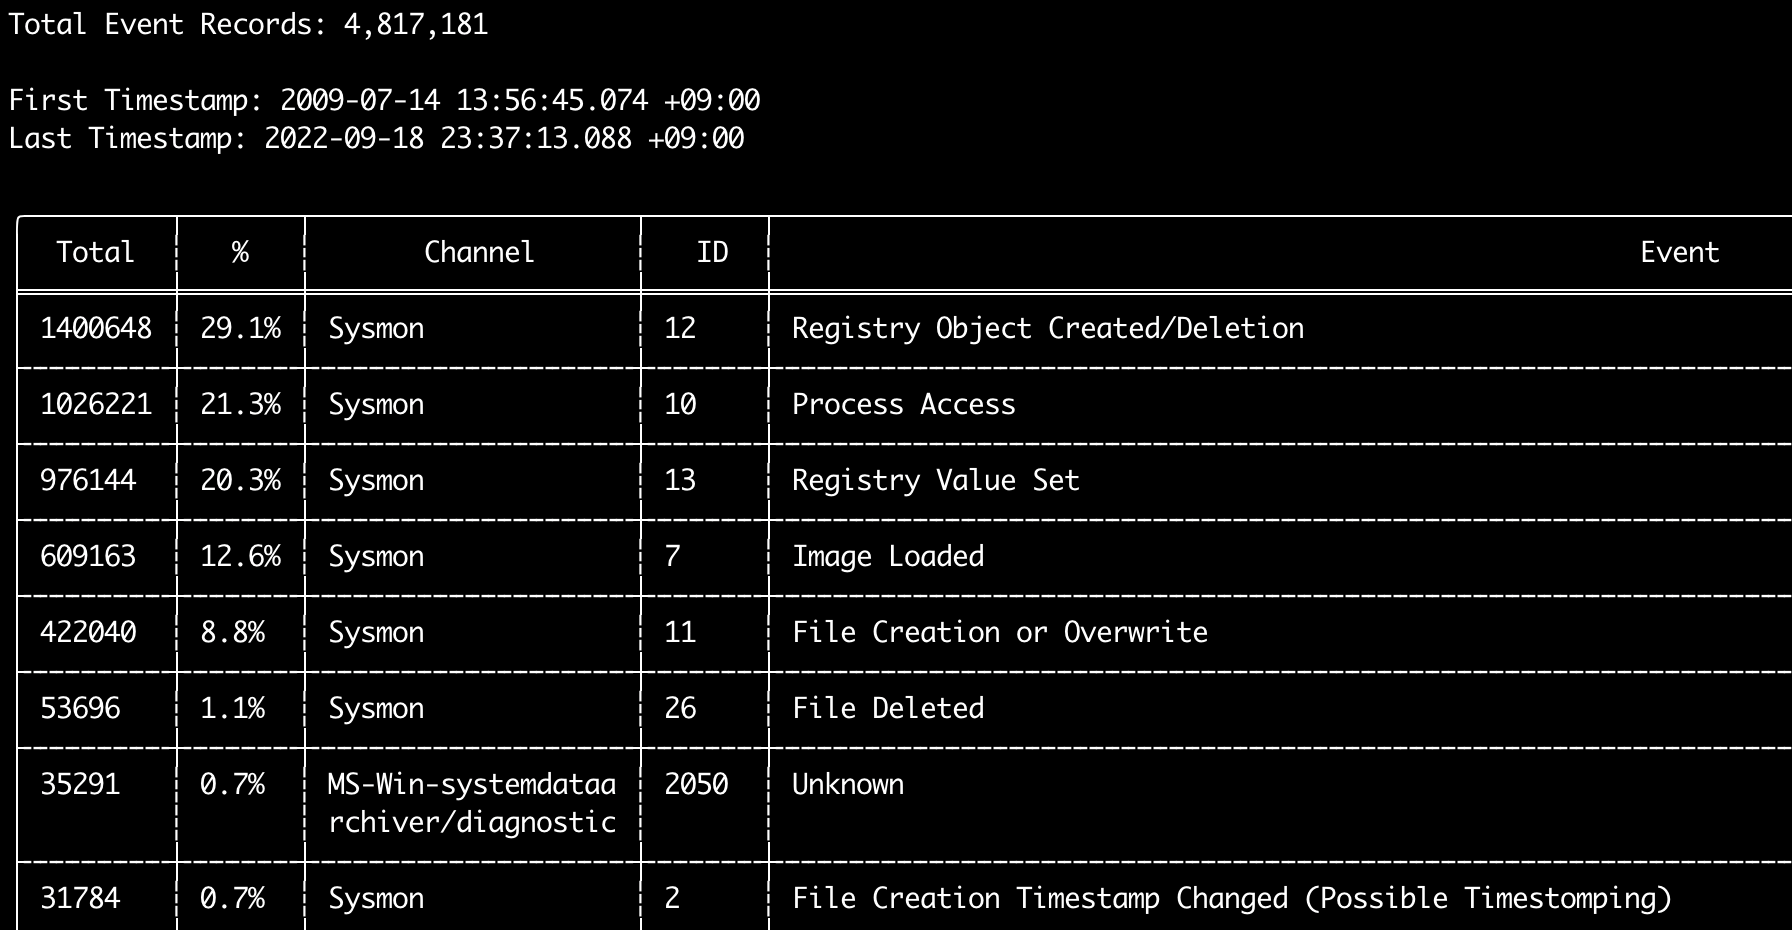
คุณสามารถใช้คำสั่ง eid-metrics เพื่อพิมพ์จำนวนรวมและเปอร์เซ็นต์ของ event ID (ฟิลด์ <System><EventID>) ที่แยกตามแชนเนล
คำสั่งนี้ไม่ใช้กฎการตรวจจับใด ๆ จึงจะสแกนเหตุการณ์ทั้งหมด
Usage: eid-metrics <INPUT> [OPTIONS]

Input:
  -d, --directory <DIR>  Directory of multiple .evtx files
  -f, --file <FILE>      File path to one .evtx file
  -l, --live-analysis    Analyze the local C:\Windows\System32\winevt\Logs folder

General Options:
  -C, --clobber                        Overwrite files when saving
  -h, --help                           Show the help menu
  -J, --JSON-input                     Scan JSON formatted logs instead of .evtx (.json or .jsonl)
  -Q, --quiet-errors                   Quiet errors mode: do not save error logs
  -x, --recover-records                Carve evtx records from slack space (default: disabled)
  -c, --rules-config <DIR>             Specify custom rule config directory (default: ./rules/config)
  -t, --threads <NUMBER>               Number of threads (default: optimal number for performance)
      --target-file-ext <FILE-EXT...>  Specify additional evtx file extensions (ex: evtx_data)

Filtering:
      --exclude-computer <COMPUTER...>  Do not scan specified computer names (ex: ComputerA) (ex: ComputerA,ComputerB)
      --include-computer <COMPUTER...>  Scan only specified computer names (ex: ComputerA) (ex: ComputerA,ComputerB)
      --time-offset <OFFSET>            Scan recent events based on an offset (ex: 1y, 3M, 30d, 24h, 30m)

Output:
  -b, --disable-abbreviations  Disable abbreviations
  -o, --output <FILE>          Save the Metrics in CSV format (ex: metrics.csv)

Display Settings:
  -K, --no-color  Disable color output
  -q, --quiet     Quiet mode: do not display the launch banner
  -v, --verbose   Output verbose information

Time Format:
      --European-time     Output timestamp in European time format (ex: 22-02-2022 22:00:00.123 +02:00)
  -O, --ISO-8601          Output timestamp in original ISO-8601 format (ex: 2022-02-22T10:10:10.1234567Z) (Always UTC)
      --RFC-2822          Output timestamp in RFC 2822 format (ex: Fri, 22 Feb 2022 22:00:00 -0600)
      --RFC-3339          Output timestamp in RFC 3339 format (ex: 2022-02-22 22:00:00.123456-06:00)
      --US-military-time  Output timestamp in US military time format (ex: 02-22-2022 22:00:00.123 -06:00)
      --US-time           Output timestamp in US time format (ex: 02-22-2022 10:00:00.123 PM -06:00)
  -U, --UTC               Output time in UTC format (default: local time)
ตัวอย่างคำสั่ง eid-metrics
- พิมพ์เมตริก Event ID จากไฟล์เดียว:
hayabusa.exe eid-metrics -f Security.evtx - พิมพ์เมตริก Event ID จากไดเรกทอรี:
hayabusa.exe eid-metrics -d ../logs - บันทึกผลลัพธ์ลงในไฟล์ CSV:
hayabusa.exe eid-metrics -f Security.evtx -o eid-metrics.csv
ไฟล์การกำหนดค่าคำสั่ง eid-metrics
แชนเนล, event ID และชื่อของเหตุการณ์ถูกกำหนดไว้ใน rules/config/channel_eid_info.txt
ตัวอย่าง:
Channel,EventID,EventTitle
Microsoft-Windows-Sysmon/Operational,1,Process Creation.
Microsoft-Windows-Sysmon/Operational,2,File Creation Timestamp Changed. (Possible Timestomping)
Microsoft-Windows-Sysmon/Operational,3,Network Connection.
Microsoft-Windows-Sysmon/Operational,4,Sysmon Service State Changed.
ภาพหน้าจอ eid-metrics
คำสั่ง expand-list
แยกตัวยึดตำแหน่ง (placeholder) expand ออกจากโฟลเดอร์ของกฎ
สิ่งนี้มีประโยชน์เมื่อสร้างไฟล์การกำหนดค่าเพื่อใช้กฎใด ๆ ที่ใช้ตัวปรับแต่งฟิลด์ expand
ในการใช้กฎ expand คุณเพียงแค่ต้องสร้างไฟล์ .txt ที่มีชื่อเดียวกับตัวปรับแต่งฟิลด์ expand ภายใต้ไดเรกทอรี ./config/expand/ และใส่ค่าทั้งหมดที่คุณต้องการตรวจสอบลงในไฟล์
ตัวอย่างเช่น หากลอจิก detection ของกฎคือ:
detection:
    selection:
        EventID: 5145
        RelativeTargetName|contains: '\winreg'
    filter_main:
        IpAddress|expand: '%Admins_Workstations%'
    condition: selection and not filter_main
คุณจะสร้างไฟล์ข้อความ ./config/expand/Admins_Workstations.txt และใส่ค่าต่าง ๆ เช่น:
ซึ่งโดยพื้นฐานแล้วจะตรวจสอบลอจิกเดียวกันกับ:
หากไฟล์การกำหนดค่าไม่มีอยู่ Hayabusa จะยังคงโหลดกฎ expand แต่จะเพิกเฉยต่อมัน
Usage:  expand-list <INPUT> [OPTIONS]

General Options:
  -h, --help              Show the help menu
  -r, --rules <DIR/FILE>  Specify rule directory (default: ./rules)

Display Settings:
  -K, --no-color  Disable color output
  -q, --quiet     Quiet mode: do not display the launch banner
ตัวอย่างคำสั่ง expand-list
- แยกตัวปรับแต่งฟิลด์
expandออกจากไดเรกทอรีrulesเริ่มต้น:hayabusa.exe expand-list - แยกตัวปรับแต่งฟิลด์
expandออกจากไดเรกทอรีsigma:hayabusa.exe eid-metrics -r ../sigma
ผลลัพธ์ expand-list
5 unique expand placeholders found:
Admins_Workstations
DC-MACHINE-NAME
Workstations
internal_domains
domain_controller_hostnames
คำสั่ง extract-base64
คำสั่งนี้จะแยกสตริง base64 ออกจากเหตุการณ์ต่อไปนี้ ถอดรหัสมัน และบอกว่ามีการใช้การเข้ารหัสประเภทใด * Security 4688 CommandLine * Sysmon 1 CommandLine, ParentCommandLine * System 7045 ImagePath * PowerShell Operational 4104 * PowerShell Operational 4103
Usage:  extract-base64 <INPUT> [OPTIONS]

Input:
  -d, --directory <DIR>  Directory of multiple .evtx files
  -f, --file <FILE>      File path to one .evtx file
  -l, --live-analysis    Analyze the local C:\Windows\System32\winevt\Logs folder

General Options:
  -C, --clobber                        Overwrite files when saving
  -h, --help                           Show the help menu
  -J, --JSON-input                     Scan JSON formatted logs instead of .evtx (.json or .jsonl)
  -Q, --quiet-errors                   Quiet errors mode: do not save error logs
  -x, --recover-records                Carve evtx records from slack space (default: disabled)
  -c, --rules-config <DIR>             Specify custom rule config directory (default: ./rules/config)
  -t, --threads <NUMBER>               Number of threads (default: optimal number for performance)
      --target-file-ext <FILE-EXT...>  Specify additional evtx file extensions (ex: evtx_data)

Filtering:
      --exclude-computer <COMPUTER...>  Do not scan specified computer names (ex: ComputerA) (ex: ComputerA,ComputerB)
      --include-computer <COMPUTER...>  Scan only specified computer names (ex: ComputerA) (ex: ComputerA,ComputerB)
      --time-offset <OFFSET>            Scan recent events based on an offset (ex: 1y, 3M, 30d, 24h, 30m)

Output:
  -o, --output <FILE>  Extract Base64 strings

Display Settings:
  -K, --no-color  Disable color output
  -q, --quiet     Quiet mode: do not display the launch banner
  -v, --verbose   Output verbose information

Time Format:
      --European-time     Output timestamp in European time format (ex: 22-02-2022 22:00:00.123 +02:00)
  -O, --ISO-8601          Output timestamp in original ISO-8601 format (ex: 2022-02-22T10:10:10.1234567Z) (Always UTC)
      --RFC-2822          Output timestamp in RFC 2822 format (ex: Fri, 22 Feb 2022 22:00:00 -0600)
      --RFC-3339          Output timestamp in RFC 3339 format (ex: 2022-02-22 22:00:00.123456-06:00)
      --US-military-time  Output timestamp in US military time format (ex: 02-22-2022 22:00:00.123 -06:00)
      --US-time           Output timestamp in US time format (ex: 02-22-2022 10:00:00.123 PM -06:00)
  -U, --UTC               Output time in UTC format (default: local time)
ตัวอย่างคำสั่ง extract-base64
- สแกนไดเรกทอรีและแสดงผลไปยังเทอร์มินัล:
hayabusa.exe extract-base64 -d ../hayabusa-sample-evtx - สแกนไดเรกทอรีและแสดงผลไปยังไฟล์ CSV:
hayabusa.exe eid-metrics -r ../sigma -o base64-extracted.csv
ผลลัพธ์ extract-base64
เมื่อแสดงผลไปยังเทอร์มินัล เนื่องจากพื้นที่มีจำกัด จะแสดงเฉพาะฟิลด์ต่อไปนี้เท่านั้น: * Timestamp * Computer * Base64 String * Decoded String (if not binary)
เมื่อบันทึกลงในไฟล์ CSV ฟิลด์ต่อไปนี้จะถูกบันทึก:
* Timestamp
* Computer
* Base64 String
* Decoded String (if not binary)
* Original Field
* Length
* Binary (Y/N)
* Double Encoding (when Y, it usually is malicious)
* Encoding Type
* File Type
* Event
* Record ID
* File Name
คำสั่ง log-metrics
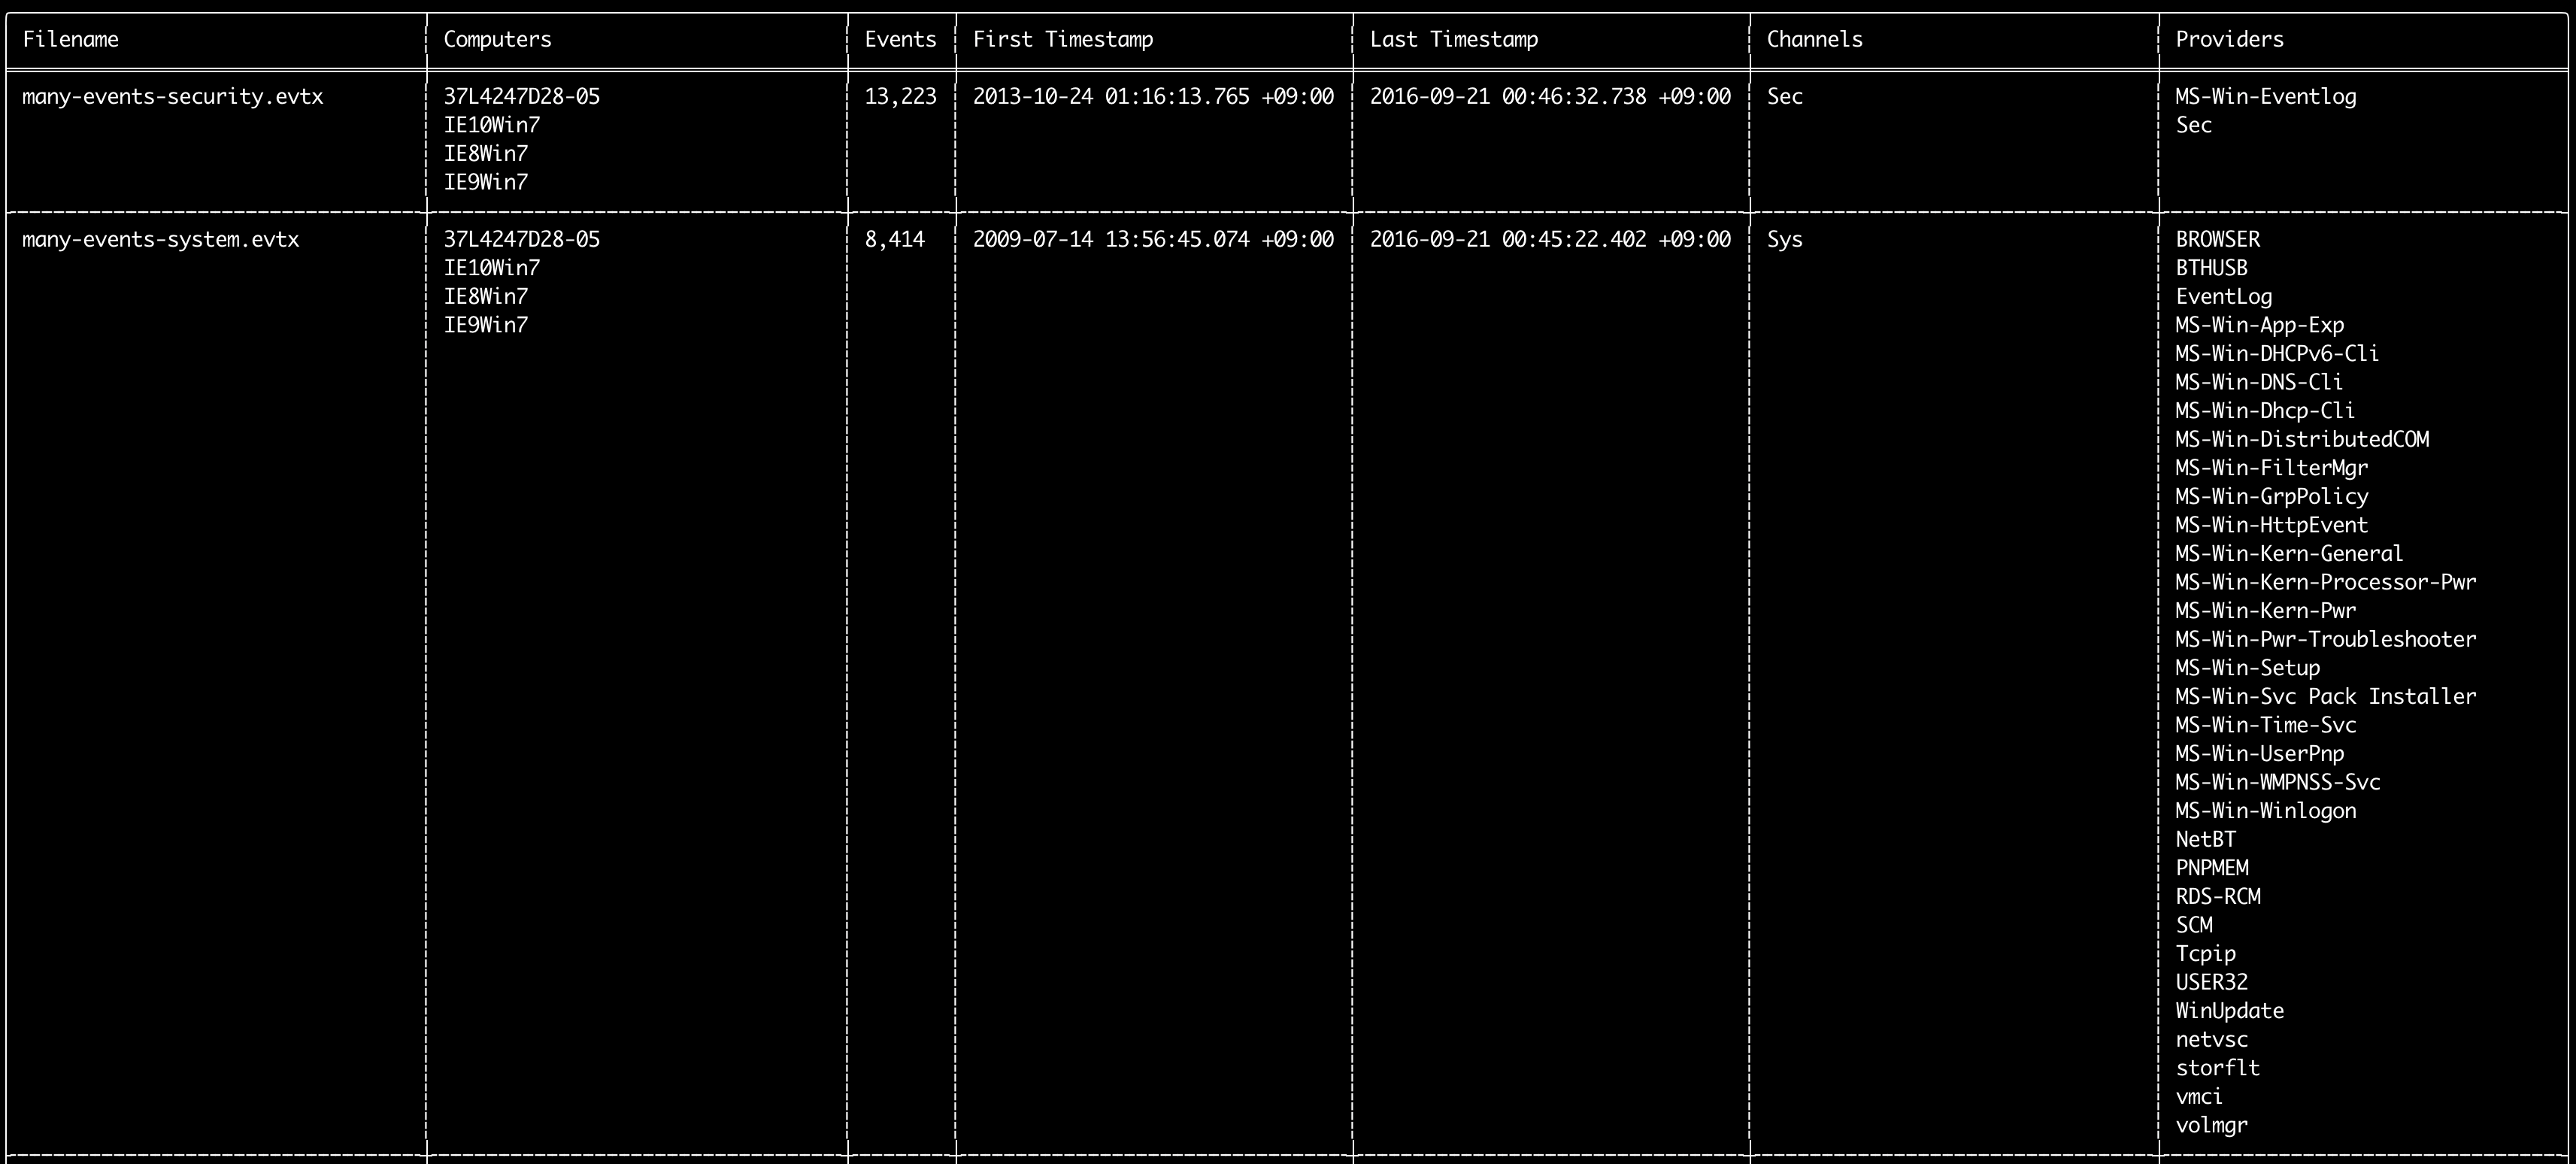
คุณสามารถใช้คำสั่ง log-metrics เพื่อพิมพ์เมตาดาตาต่อไปนี้ภายในบันทึกเหตุการณ์:
* Filename
* Computer names
* Number of events
* First timestamp
* Last timestamp
* Channels
* Providers
คำสั่งนี้ไม่ใช้กฎการตรวจจับใด ๆ จึงจะสแกนเหตุการณ์ทั้งหมด
Usage: log-metrics <INPUT> [OPTIONS]

Input:
  -d, --directory <DIR>  Directory of multiple .evtx files
  -f, --file <FILE>      File path to one .evtx file
  -l, --live-analysis    Analyze the local C:\Windows\System32\winevt\Logs folder

General Options:
  -C, --clobber                        Overwrite files when saving
  -h, --help                           Show the help menu
  -J, --JSON-input                     Scan JSON formatted logs instead of .evtx (.json or .jsonl)
  -Q, --quiet-errors                   Quiet errors mode: do not save error logs
  -x, --recover-records                Carve evtx records from slack space (default: disabled)
  -c, --rules-config <DIR>             Specify custom rule config directory (default: ./rules/config)
  -t, --threads <NUMBER>               Number of threads (default: optimal number for performance)
      --target-file-ext <FILE-EXT...>  Specify additional evtx file extensions (ex: evtx_data)

Filtering:
      --exclude-computer <COMPUTER...>  Do not scan specified computer names (ex: ComputerA) (ex: ComputerA,ComputerB)
      --include-computer <COMPUTER...>  Scan only specified computer names (ex: ComputerA) (ex: ComputerA,ComputerB)
      --time-offset <OFFSET>            Scan recent events based on an offset (ex: 1y, 3M, 30d, 24h, 30m)

Output:
  -b, --disable-abbreviations  Disable abbreviations
  -M, --multiline              Output event field information in multiple rows for CSV output
  -o, --output <FILE>          Save the Metrics in CSV format (ex: metrics.csv)
  -S, --tab-separator          Separate event field information by tabs

Display Settings:
  -K, --no-color  Disable color output
  -q, --quiet     Quiet mode: do not display the launch banner
  -v, --verbose   Output verbose information

Time Format:
      --European-time     Output timestamp in European time format (ex: 22-02-2022 22:00:00.123 +02:00)
  -O, --ISO-8601          Output timestamp in original ISO-8601 format (ex: 2022-02-22T10:10:10.1234567Z) (Always UTC)
      --RFC-2822          Output timestamp in RFC 2822 format (ex: Fri, 22 Feb 2022 22:00:00 -0600)
      --RFC-3339          Output timestamp in RFC 3339 format (ex: 2022-02-22 22:00:00.123456-06:00)
      --US-military-time  Output timestamp in US military time format (ex: 02-22-2022 22:00:00.123 -06:00)
      --US-time           Output timestamp in US time format (ex: 02-22-2022 10:00:00.123 PM -06:00)
  -U, --UTC               Output time in UTC format (default: local time)
ตัวอย่างคำสั่ง log-metrics
- พิมพ์เมตริก Event ID จากไฟล์เดียว:
hayabusa.exe log-metrics -f Security.evtx - พิมพ์เมตริก Event ID จากไดเรกทอรี:
hayabusa.exe log-metrics -d ../logs - บันทึกผลลัพธ์ลงในไฟล์ CSV:
hayabusa.exe log-metrics -d ../logs -o eid-metrics.csv
ภาพหน้าจอ log-metrics
คำสั่ง logon-summary
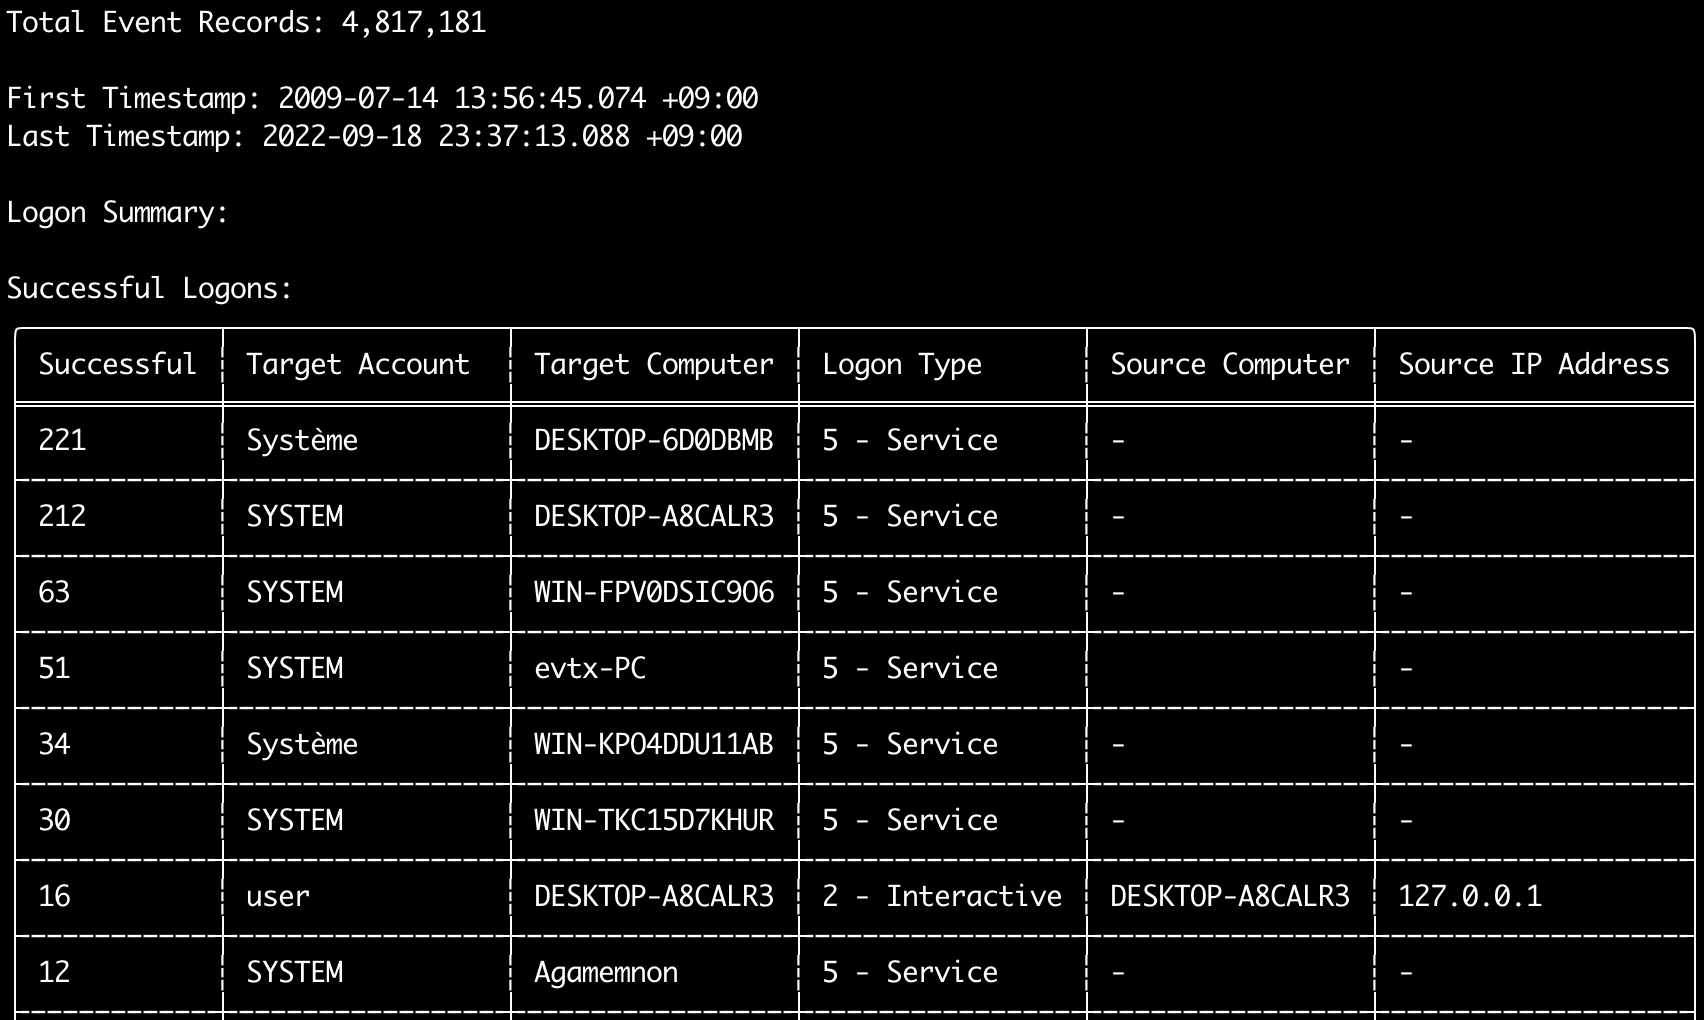
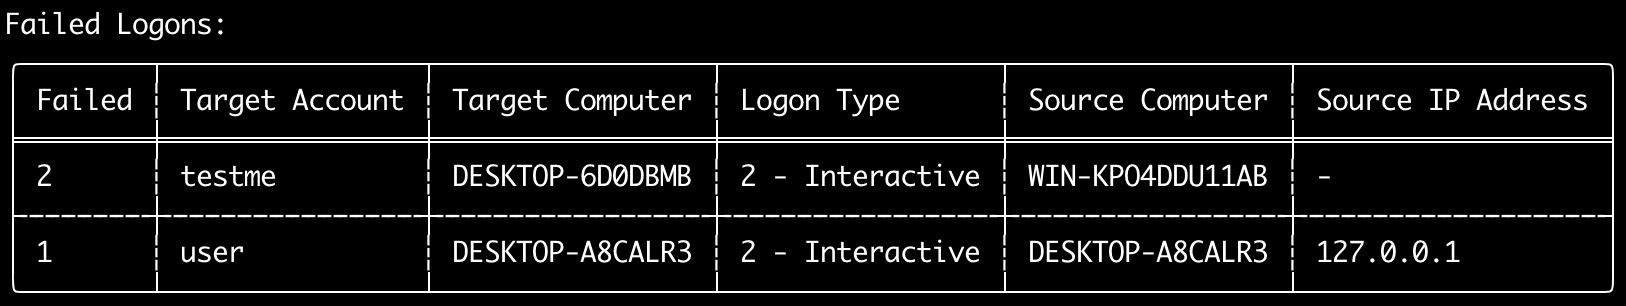
คุณสามารถใช้คำสั่ง logon-summary เพื่อแสดงสรุปข้อมูลการล็อกออน (ชื่อผู้ใช้ที่ล็อกออน และจำนวนการล็อกออนที่สำเร็จและล้มเหลว)
คุณสามารถแสดงข้อมูลการล็อกออนสำหรับไฟล์ evtx เดียวด้วย -f หรือไฟล์ evtx หลายไฟล์ด้วยตัวเลือก -d
การล็อกออนที่สำเร็จมาจากเหตุการณ์ต่อไปนี้:
* Security 4624 (Successful Logon)
* RDS-LSM 21 (Remote Desktop Service Local Session Manager Logon)
* RDS-GTW 302 (Remote Desktop Service Gateway Logon)
การล็อกออนที่ล้มเหลวมาจากเหตุการณ์ Security 4625
Usage: logon-summary <INPUT> [OPTIONS]

Input:
  -d, --directory <DIR>  Directory of multiple .evtx files
  -f, --file <FILE>      File path to one .evtx file
  -l, --live-analysis    Analyze the local C:\Windows\System32\winevt\Logs folder

General Options:
  -C, --clobber                        Overwrite files when saving
  -h, --help                           Show the help menu
  -J, --JSON-input                     Scan JSON formatted logs instead of .evtx (.json or .jsonl)
  -Q, --quiet-errors                   Quiet errors mode: do not save error logs
  -x, --recover-records                Carve evtx records from slack space (default: disabled)
  -c, --rules-config <DIR>             Specify custom rule config directory (default: ./rules/config)
  -t, --threads <NUMBER>               Number of threads (default: optimal number for performance)
      --target-file-ext <FILE-EXT...>  Specify additional evtx file extensions (ex: evtx_data)

Filtering:
      --exclude-computer <COMPUTER...>  Do not scan specified computer names (ex: ComputerA) (ex: ComputerA,ComputerB)
      --include-computer <COMPUTER...>  Scan only specified computer names (ex: ComputerA) (ex: ComputerA,ComputerB)
      --time-offset <OFFSET>            Scan recent events based on an offset (ex: 1y, 3M, 30d, 24h, 30m)
      --timeline-end <DATE>             End time of the event logs to load (ex: "2022-02-22 23:59:59 +09:00")
      --timeline-start <DATE>           Start time of the event logs to load (ex: "2020-02-22 00:00:00 +09:00")

Output:
  -o, --output <FILENAME-PREFIX>  Save the logon summary to two CSV files (ex: -o logon-summary)

Display Settings:
  -K, --no-color  Disable color output
  -q, --quiet     Quiet mode: do not display the launch banner
  -v, --verbose   Output verbose information

Time Format:
      --European-time     Output timestamp in European time format (ex: 22-02-2022 22:00:00.123 +02:00)
  -O, --ISO-8601          Output timestamp in original ISO-8601 format (ex: 2022-02-22T10:10:10.1234567Z) (Always UTC)
      --RFC-2822          Output timestamp in RFC 2822 format (ex: Fri, 22 Feb 2022 22:00:00 -0600)
      --RFC-3339          Output timestamp in RFC 3339 format (ex: 2022-02-22 22:00:00.123456-06:00)
      --US-military-time  Output timestamp in US military time format (ex: 02-22-2022 22:00:00.123 -06:00)
      --US-time           Output timestamp in US time format (ex: 02-22-2022 10:00:00.123 PM -06:00)
  -U, --UTC               Output time in UTC format (default: local time)
ตัวอย่างคำสั่ง logon-summary
- พิมพ์สรุปการล็อกออน:
hayabusa.exe logon-summary -f Security.evtx - บันทึกผลลัพธ์สรุปการล็อกออน:
hayabusa.exe logon-summary -d ../logs -o logon-summary.csv
ภาพหน้าจอ logon-summary
คำสั่ง pivot-keywords-list
คุณสามารถใช้คำสั่ง pivot-keywords-list เพื่อสร้างรายการคีย์เวิร์ดสำหรับใช้เป็นจุดอ้างอิง (pivot) ที่ไม่ซ้ำกัน เพื่อระบุผู้ใช้, ชื่อโฮสต์, กระบวนการที่ผิดปกติ ฯลฯ ได้อย่างรวดเร็ว รวมถึงเชื่อมโยงเหตุการณ์ต่าง ๆ
สำคัญ: โดยค่าเริ่มต้น hayabusa จะส่งคืนผลลัพธ์จากเหตุการณ์ทั้งหมด (ระดับ informational ขึ้นไป) ดังนั้นเราขอแนะนำอย่างยิ่งให้ใช้คำสั่ง pivot-keywords-list ร่วมกับตัวเลือก -m, --min-level
ตัวอย่างเช่น เริ่มต้นด้วยการสร้างคีย์เวิร์ดจากการแจ้งเตือนระดับ critical เท่านั้นด้วย -m critical จากนั้นจึงดำเนินการต่อด้วย -m high, -m medium ฯลฯ
ในผลลัพธ์ของคุณมักจะมีคีย์เวิร์ดทั่วไปที่จะตรงกับเหตุการณ์ปกติจำนวนมาก ดังนั้นหลังจากตรวจสอบผลลัพธ์ด้วยตนเองและสร้างรายการคีย์เวิร์ดที่ไม่ซ้ำกันในไฟล์เดียว คุณจึงสามารถสร้างไทม์ไลน์ที่จำกัดเฉพาะกิจกรรมที่น่าสงสัยได้ด้วยคำสั่งเช่น grep -f keywords.txt timeline.csv
Usage: pivot-keywords-list <INPUT> [OPTIONS]

Input:
  -d, --directory <DIR>  Directory of multiple .evtx files
  -f, --file <FILE>      File path to one .evtx file
  -l, --live-analysis    Analyze the local C:\Windows\System32\winevt\Logs folder

General Options:
  -C, --clobber                        Overwrite files when saving
  -h, --help                           Show the help menu
  -J, --JSON-input                     Scan JSON formatted logs instead of .evtx (.json or .jsonl)
  -w, --no-wizard                      Do not ask questions. Scan for all events and alerts
  -Q, --quiet-errors                   Quiet errors mode: do not save error logs
  -x, --recover-records                Carve evtx records from slack space (default: disabled)
  -c, --rules-config <DIR>             Specify custom rule config directory (default: ./rules/config)
  -t, --threads <NUMBER>               Number of threads (default: optimal number for performance)
      --target-file-ext <FILE-EXT...>  Specify additional evtx file extensions (ex: evtx_data)

Filtering:
  -E, --EID-filter                      Scan only common EIDs for faster speed (./rules/config/target_event_IDs.txt)
  -D, --enable-deprecated-rules         Enable rules with a status of deprecated
  -n, --enable-noisy-rules              Enable rules set to noisy (./rules/config/noisy_rules.txt)
  -u, --enable-unsupported-rules        Enable rules with a status of unsupported
  -e, --exact-level <LEVEL>             Only load rules with a specific level (informational, low, medium, high, critical)
      --exclude-computer <COMPUTER...>  Do not scan specified computer names (ex: ComputerA) (ex: ComputerA,ComputerB)
      --exclude-eid <EID...>            Do not scan specific EIDs for faster speed (ex: 1) (ex: 1,4688)
      --exclude-status <STATUS...>      Do not load rules according to status (ex: experimental) (ex: stable,test)
      --exclude-tag <TAG...>            Do not load rules with specific tags (ex: sysmon)
      --include-computer <COMPUTER...>  Scan only specified computer names (ex: ComputerA) (ex: ComputerA,ComputerB)
      --include-eid <EID...>            Scan only specified EIDs for faster speed (ex: 1) (ex: 1,4688)
      --include-status <STATUS...>      Only load rules with specific status (ex: experimental) (ex: stable,test)
      --include-tag <TAG...>            Only load rules with specific tags (ex: attack.execution,attack.discovery)
  -m, --min-level <LEVEL>               Minimum level for rules to load (default: informational)
      --time-offset <OFFSET>            Scan recent events based on an offset (ex: 1y, 3M, 30d, 24h, 30m)
      --timeline-end <DATE>             End time of the event logs to load (ex: "2022-02-22 23:59:59 +09:00")
      --timeline-start <DATE>           Start time of the event logs to load (ex: "2020-02-22 00:00:00 +09:00")

Output:
  -o, --output <FILENAME-PREFIX>  Save pivot words to separate files (ex: PivotKeywords)

Display Settings:
  -K, --no-color  Disable color output
  -q, --quiet     Quiet mode: do not display the launch banner
  -v, --verbose   Output verbose information
ตัวอย่างคำสั่ง pivot-keywords-list
- แสดงคีย์เวิร์ดสำหรับ pivot ไปยังหน้าจอ:
hayabusa.exe pivot-keywords-list -d ../logs -m critical - สร้างรายการคีย์เวิร์ดสำหรับ pivot จากการแจ้งเตือนระดับ critical และบันทึกผลลัพธ์ (ผลลัพธ์จะถูกบันทึกไปยัง
keywords-Ip Addresses.txt,keywords-Users.txtฯลฯ):
ไฟล์การกำหนดค่าคำสั่ง pivot-keywords-list
คุณสามารถปรับแต่งคีย์เวิร์ดที่คุณต้องการค้นหาได้โดยการแก้ไข ./rules/config/pivot_keywords.txt
หน้านี้ คือการตั้งค่าเริ่มต้น
รูปแบบคือ KeywordName.FieldName ตัวอย่างเช่น เมื่อสร้างรายการของ Users hayabusa จะแสดงรายการค่าทั้งหมดในฟิลด์ SubjectUserName, TargetUserName และ User
คำสั่ง search
คำสั่ง search จะช่วยให้คุณค้นหาคีย์เวิร์ดในเหตุการณ์ทั้งหมด
(ไม่ใช่แค่ผลการตรวจจับของ Hayabusa เท่านั้น)
สิ่งนี้มีประโยชน์ในการพิจารณาว่ามีหลักฐานใด ๆ ในเหตุการณ์ที่ไม่ถูกตรวจจับโดย Hayabusa หรือไม่
Usage: hayabusa.exe search <INPUT> <--keywords "<KEYWORDS>" OR --regex "<REGEX>"> [OPTIONS]

Display Settings:
  -K, --no-color  Disable color output
  -q, --quiet     Quiet mode: do not display the launch banner
  -v, --verbose   Output verbose information

General Options:
  -C, --clobber                        Overwrite files when saving
  -h, --help                           Show the help menu
  -Q, --quiet-errors                   Quiet errors mode: do not save error logs
  -x, --recover-records                Carve evtx records from slack space (default: disabled)
  -c, --rules-config <DIR>             Specify custom rule config directory (default: ./rules/config)
  -t, --threads <NUMBER>               Number of threads (default: optimal number for performance)
      --target-file-ext <FILE-EXT...>  Specify additional evtx file extensions (ex: evtx_data)
  -s, --sort                           Sort results before saving the file (warning: this uses much more memory!)

Input:
  -d, --directory <DIR>  Directory of multiple .evtx files
  -f, --file <FILE>      File path to one .evtx file
  -l, --live-analysis    Analyze the local C:\Windows\System32\winevt\Logs folder

Filtering:
  -a, --and-logic              Search keywords with AND logic (default: OR)
  -F, --filter <FILTER...>     Filter by specific field(s)
  -i, --ignore-case            Case-insensitive keyword search
  -k, --keyword <KEYWORD...>   Search by keyword(s)
  -r, --regex <REGEX>          Search by regular expression
      --time-offset <OFFSET>   Scan recent events based on an offset (ex: 1y, 3M, 30d, 24h, 30m)
      --timeline-end <DATE>    End time of the event logs to load (ex: "2022-02-22 23:59:59 +09:00")
      --timeline-start <DATE>  Start time of the event logs to load (ex: "2020-02-22 00:00:00 +09:00")

Output:
  -b, --disable-abbreviations  Disable abbreviations
  -J, --JSON-output            Save the search results in JSON format (ex: -J -o results.json)
  -L, --JSONL-output           Save the search results in JSONL format (ex: -L -o results.jsonl)
  -M, --multiline              Output event field information in multiple rows for CSV output
  -o, --output <FILE>          Save the search results in CSV format (ex: search.csv)
  -S, --tab-separator          Separate event field information by tabs

Time Format:
      --European-time     Output timestamp in European time format (ex: 22-02-2022 22:00:00.123 +02:00)
  -O, --ISO-8601          Output timestamp in original ISO-8601 format (ex: 2022-02-22T10:10:10.1234567Z) (Always UTC)
      --RFC-2822          Output timestamp in RFC 2822 format (ex: Fri, 22 Feb 2022 22:00:00 -0600)
      --RFC-3339          Output timestamp in RFC 3339 format (ex: 2022-02-22 22:00:00.123456-06:00)
      --US-military-time  Output timestamp in US military time format (ex: 02-22-2022 22:00:00.123 -06:00)
      --US-time           Output timestamp in US time format (ex: 02-22-2022 10:00:00.123 PM -06:00)
  -U, --UTC               Output time in UTC format (default: local time)
ตัวอย่างคำสั่ง search
- ค้นหาในไดเรกทอรี
../hayabusa-sample-evtxสำหรับคีย์เวิร์ดmimikatz:
หมายเหตุ: คีย์เวิร์ดจะตรงกันหากพบ
mimikatzที่ใดก็ตามในข้อมูล ไม่ใช่การจับคู่แบบตรงทุกตัวอักษร
- ค้นหาในไดเรกทอรี
../hayabusa-sample-evtxสำหรับคีย์เวิร์ดmimikatzหรือkali:
- ค้นหาในไดเรกทอรี
../hayabusa-sample-evtxสำหรับคีย์เวิร์ดmimikatzและไม่สนใจตัวพิมพ์เล็ก/ใหญ่:
- ค้นหาในไดเรกทอรี
../hayabusa-sample-evtxสำหรับที่อยู่ IP โดยใช้นิพจน์ทั่วไป (regular expression):
- ค้นหาในไดเรกทอรี
../hayabusa-sample-evtxและแสดงเหตุการณ์ทั้งหมดที่ฟิลด์WorkstationNameเป็นkali:
หมายเหตุ:
.*คือนิพจน์ทั่วไปที่จับคู่กับทุกเหตุการณ์
ไฟล์การกำหนดค่าคำสั่ง search
./rules/config/channel_abbreviations.txt: การจับคู่ระหว่างชื่อแชนเนลและตัวย่อของพวกมัน