분석 명령어
computer-metrics 명령어
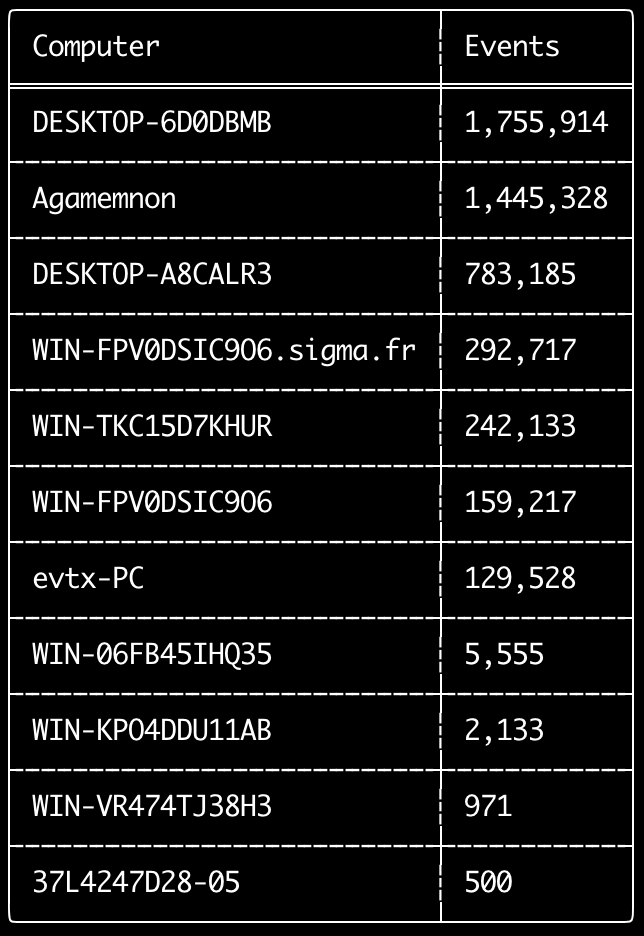
computer-metrics 명령어를 사용하면 <System><Computer> 필드에 정의된 각 컴퓨터에 따라 이벤트가 얼마나 있는지 확인할 수 있습니다.
이벤트를 원래의 컴퓨터별로 구분하는 데 Computer 필드를 완전히 신뢰할 수는 없다는 점에 유의하십시오.
Windows 11은 이벤트 로그에 저장할 때 가끔 완전히 다른 Computer 이름을 사용합니다.
또한 Windows 10은 가끔 Computer 이름을 모두 소문자로 기록합니다.
이 명령어는 어떠한 탐지 규칙도 사용하지 않으므로 모든 이벤트를 분석합니다.
어떤 컴퓨터에 로그가 가장 많은지 빠르게 확인하기에 좋은 명령어입니다.
이 정보를 활용하면 타임라인을 생성할 때 --include-computer 또는 --exclude-computer 옵션을 사용하여 컴퓨터별로 여러 개의 타임라인을 생성하거나 특정 컴퓨터의 이벤트를 제외함으로써 타임라인 생성을 더 효율적으로 할 수 있습니다.
Usage: computer-metrics <INPUT> [OPTIONS]

Input:
  -d, --directory <DIR>  Directory of multiple .evtx files
  -f, --file <FILE>      File path to one .evtx file
  -l, --live-analysis    Analyze the local C:\Windows\System32\winevt\Logs folder

General Options:
  -C, --clobber                        Overwrite files when saving
  -h, --help                           Show the help menu
  -J, --JSON-input                     Scan JSON formatted logs instead of .evtx (.json or .jsonl)
  -Q, --quiet-errors                   Quiet errors mode: do not save error logs
  -x, --recover-records                Carve evtx records from slack space (default: disabled)
  -c, --rules-config <DIR>             Specify custom rule config directory (default: ./rules/config)
      --target-file-ext <FILE-EXT...>  Specify additional evtx file extensions (ex: evtx_data)
  -t, --threads <NUMBER>               Number of threads (default: optimal number for performance)

Filtering:
      --time-offset <OFFSET>  Scan recent events based on an offset (ex: 1y, 3M, 30d, 24h, 30m)

Output:
  -o, --output <FILE>  Save the results in CSV format (ex: computer-metrics.csv)

Display Settings:
  -K, --no-color  Disable color output
  -q, --quiet     Quiet mode: do not display the launch banner
  -v, --verbose   Output verbose information
computer-metrics 명령어 예시
- 디렉터리에서 컴퓨터 이름 메트릭 출력:
hayabusa.exe computer-metrics -d ../logs - 결과를 CSV 파일로 저장:
hayabusa.exe computer-metrics -d ../logs -o computer-metrics.csv
computer-metrics 스크린샷
eid-metrics 명령어
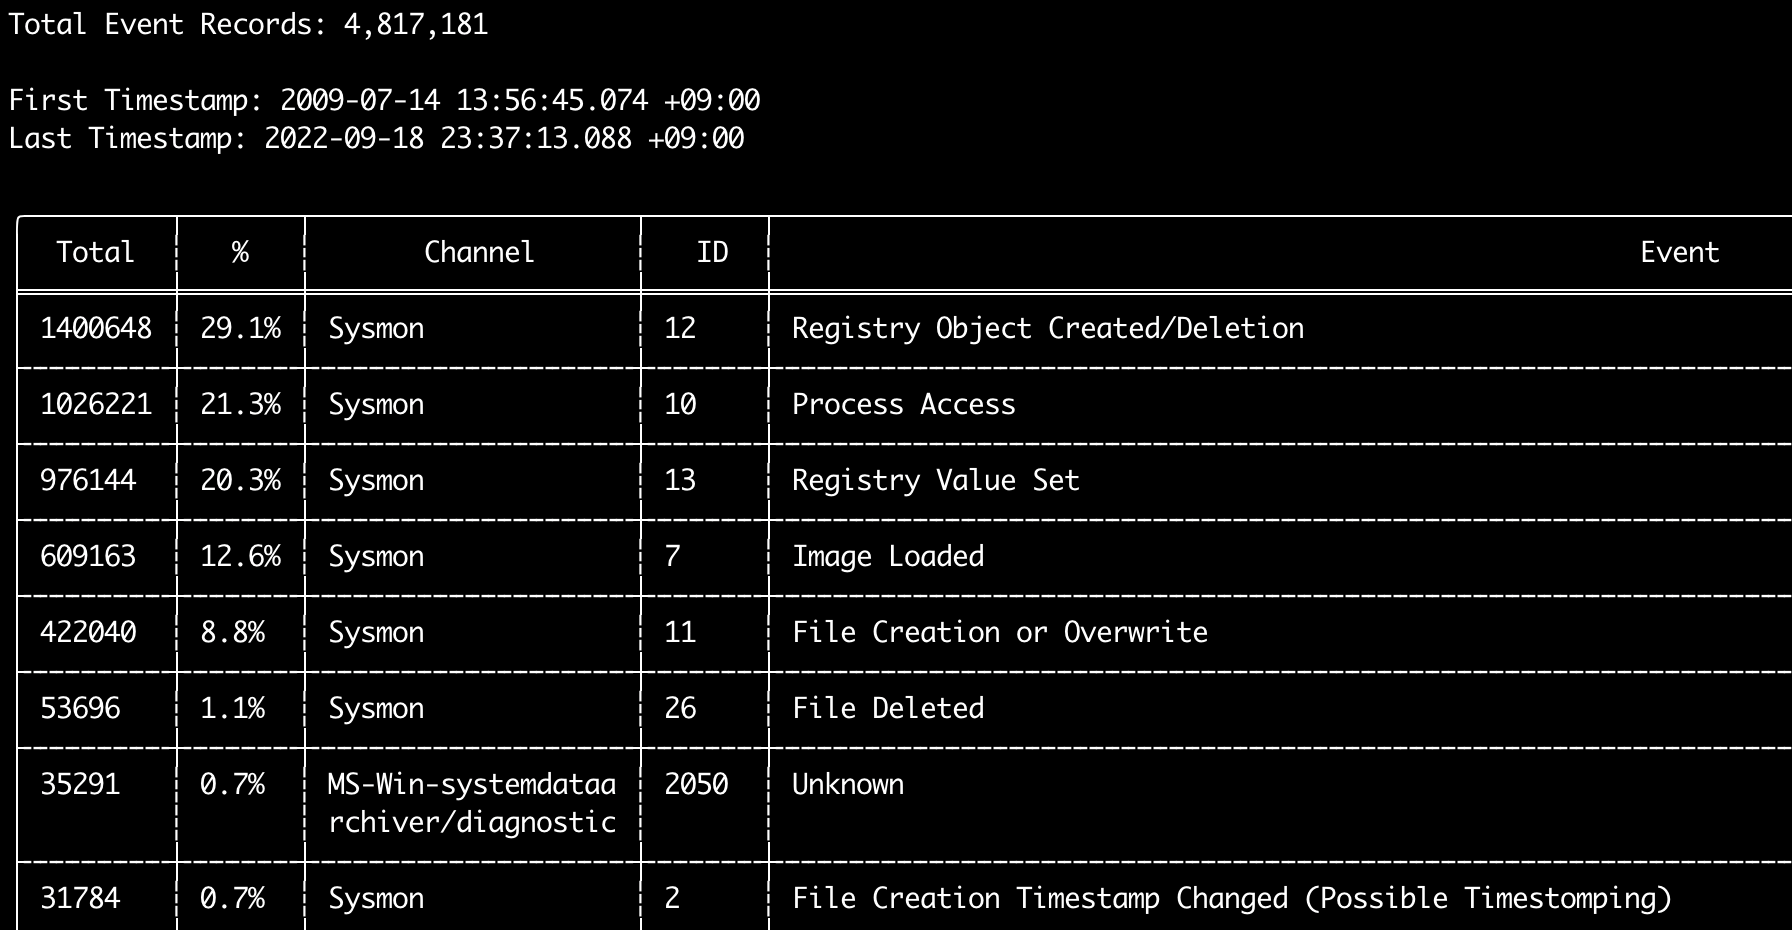
eid-metrics 명령어를 사용하면 채널별로 구분된 이벤트 ID(<System><EventID> 필드)의 총 개수와 비율을 출력할 수 있습니다.
이 명령어는 어떠한 탐지 규칙도 사용하지 않으므로 모든 이벤트를 스캔합니다.
Usage: eid-metrics <INPUT> [OPTIONS]

Input:
  -d, --directory <DIR>  Directory of multiple .evtx files
  -f, --file <FILE>      File path to one .evtx file
  -l, --live-analysis    Analyze the local C:\Windows\System32\winevt\Logs folder

General Options:
  -C, --clobber                        Overwrite files when saving
  -h, --help                           Show the help menu
  -J, --JSON-input                     Scan JSON formatted logs instead of .evtx (.json or .jsonl)
  -Q, --quiet-errors                   Quiet errors mode: do not save error logs
  -x, --recover-records                Carve evtx records from slack space (default: disabled)
  -c, --rules-config <DIR>             Specify custom rule config directory (default: ./rules/config)
  -t, --threads <NUMBER>               Number of threads (default: optimal number for performance)
      --target-file-ext <FILE-EXT...>  Specify additional evtx file extensions (ex: evtx_data)

Filtering:
      --exclude-computer <COMPUTER...>  Do not scan specified computer names (ex: ComputerA) (ex: ComputerA,ComputerB)
      --include-computer <COMPUTER...>  Scan only specified computer names (ex: ComputerA) (ex: ComputerA,ComputerB)
      --time-offset <OFFSET>            Scan recent events based on an offset (ex: 1y, 3M, 30d, 24h, 30m)

Output:
  -b, --disable-abbreviations  Disable abbreviations
  -o, --output <FILE>          Save the Metrics in CSV format (ex: metrics.csv)

Display Settings:
  -K, --no-color  Disable color output
  -q, --quiet     Quiet mode: do not display the launch banner
  -v, --verbose   Output verbose information

Time Format:
      --European-time     Output timestamp in European time format (ex: 22-02-2022 22:00:00.123 +02:00)
  -O, --ISO-8601          Output timestamp in original ISO-8601 format (ex: 2022-02-22T10:10:10.1234567Z) (Always UTC)
      --RFC-2822          Output timestamp in RFC 2822 format (ex: Fri, 22 Feb 2022 22:00:00 -0600)
      --RFC-3339          Output timestamp in RFC 3339 format (ex: 2022-02-22 22:00:00.123456-06:00)
      --US-military-time  Output timestamp in US military time format (ex: 02-22-2022 22:00:00.123 -06:00)
      --US-time           Output timestamp in US time format (ex: 02-22-2022 10:00:00.123 PM -06:00)
  -U, --UTC               Output time in UTC format (default: local time)
eid-metrics 명령어 예시
- 단일 파일에서 이벤트 ID 메트릭 출력:
hayabusa.exe eid-metrics -f Security.evtx - 디렉터리에서 이벤트 ID 메트릭 출력:
hayabusa.exe eid-metrics -d ../logs - 결과를 CSV 파일로 저장:
hayabusa.exe eid-metrics -f Security.evtx -o eid-metrics.csv
eid-metrics 명령어 설정 파일
이벤트의 채널, 이벤트 ID 및 제목은 rules/config/channel_eid_info.txt에 정의되어 있습니다.
예시:
Channel,EventID,EventTitle
Microsoft-Windows-Sysmon/Operational,1,Process Creation.
Microsoft-Windows-Sysmon/Operational,2,File Creation Timestamp Changed. (Possible Timestomping)
Microsoft-Windows-Sysmon/Operational,3,Network Connection.
Microsoft-Windows-Sysmon/Operational,4,Sysmon Service State Changed.
eid-metrics 스크린샷
expand-list 명령어
규칙 폴더에서 expand 플레이스홀더를 추출합니다.
이는 expand 필드 수정자를 사용하는 규칙을 활용하기 위한 설정 파일을 만들 때 유용합니다.
expand 규칙을 사용하려면 ./config/expand/ 디렉터리 아래에 expand 필드 수정자의 이름으로 된 .txt 파일을 만들고, 확인하려는 모든 값을 파일 안에 넣기만 하면 됩니다.
예를 들어, 규칙의 detection 로직이 다음과 같다면:
detection:
    selection:
        EventID: 5145
        RelativeTargetName|contains: '\winreg'
    filter_main:
        IpAddress|expand: '%Admins_Workstations%'
    condition: selection and not filter_main
./config/expand/Admins_Workstations.txt 텍스트 파일을 만들고 다음과 같은 값을 넣으면 됩니다:
이는 본질적으로 다음과 같은 로직을 확인하는 것과 같습니다:
설정 파일이 존재하지 않으면 Hayabusa는 여전히 expand 규칙을 로드하지만 무시합니다.
Usage:  expand-list <INPUT> [OPTIONS]

General Options:
  -h, --help              Show the help menu
  -r, --rules <DIR/FILE>  Specify rule directory (default: ./rules)

Display Settings:
  -K, --no-color  Disable color output
  -q, --quiet     Quiet mode: do not display the launch banner
expand-list 명령어 예시
- 기본
rules디렉터리에서expand필드 수정자 추출:hayabusa.exe expand-list sigma디렉터리에서expand필드 수정자 추출:hayabusa.exe eid-metrics -r ../sigma
expand-list 결과
5 unique expand placeholders found:
Admins_Workstations
DC-MACHINE-NAME
Workstations
internal_domains
domain_controller_hostnames
extract-base64 명령어
이 명령어는 다음 이벤트에서 base64 문자열을 추출하여 디코딩하고 어떤 종류의 인코딩이 사용되고 있는지 알려줍니다. * Security 4688 CommandLine * Sysmon 1 CommandLine, ParentCommandLine * System 7045 ImagePath * PowerShell Operational 4104 * PowerShell Operational 4103
Usage:  extract-base64 <INPUT> [OPTIONS]

Input:
  -d, --directory <DIR>  Directory of multiple .evtx files
  -f, --file <FILE>      File path to one .evtx file
  -l, --live-analysis    Analyze the local C:\Windows\System32\winevt\Logs folder

General Options:
  -C, --clobber                        Overwrite files when saving
  -h, --help                           Show the help menu
  -J, --JSON-input                     Scan JSON formatted logs instead of .evtx (.json or .jsonl)
  -Q, --quiet-errors                   Quiet errors mode: do not save error logs
  -x, --recover-records                Carve evtx records from slack space (default: disabled)
  -c, --rules-config <DIR>             Specify custom rule config directory (default: ./rules/config)
  -t, --threads <NUMBER>               Number of threads (default: optimal number for performance)
      --target-file-ext <FILE-EXT...>  Specify additional evtx file extensions (ex: evtx_data)

Filtering:
      --exclude-computer <COMPUTER...>  Do not scan specified computer names (ex: ComputerA) (ex: ComputerA,ComputerB)
      --include-computer <COMPUTER...>  Scan only specified computer names (ex: ComputerA) (ex: ComputerA,ComputerB)
      --time-offset <OFFSET>            Scan recent events based on an offset (ex: 1y, 3M, 30d, 24h, 30m)

Output:
  -o, --output <FILE>  Extract Base64 strings

Display Settings:
  -K, --no-color  Disable color output
  -q, --quiet     Quiet mode: do not display the launch banner
  -v, --verbose   Output verbose information

Time Format:
      --European-time     Output timestamp in European time format (ex: 22-02-2022 22:00:00.123 +02:00)
  -O, --ISO-8601          Output timestamp in original ISO-8601 format (ex: 2022-02-22T10:10:10.1234567Z) (Always UTC)
      --RFC-2822          Output timestamp in RFC 2822 format (ex: Fri, 22 Feb 2022 22:00:00 -0600)
      --RFC-3339          Output timestamp in RFC 3339 format (ex: 2022-02-22 22:00:00.123456-06:00)
      --US-military-time  Output timestamp in US military time format (ex: 02-22-2022 22:00:00.123 -06:00)
      --US-time           Output timestamp in US time format (ex: 02-22-2022 10:00:00.123 PM -06:00)
  -U, --UTC               Output time in UTC format (default: local time)
extract-base64 명령어 예시
- 디렉터리를 스캔하여 터미널로 출력:
hayabusa.exe extract-base64 -d ../hayabusa-sample-evtx - 디렉터리를 스캔하여 CSV 파일로 출력:
hayabusa.exe eid-metrics -r ../sigma -o base64-extracted.csv
extract-base64 결과
터미널로 출력할 때는 공간이 제한되어 있으므로 다음 필드만 표시됩니다: * Timestamp * Computer * Base64 String * Decoded String (if not binary)
CSV 파일로 저장할 때는 다음 필드가 저장됩니다:
* Timestamp
* Computer
* Base64 String
* Decoded String (if not binary)
* Original Field
* Length
* Binary (Y/N)
* Double Encoding (when Y, it usually is malicious)
* Encoding Type
* File Type
* Event
* Record ID
* File Name
log-metrics 명령어
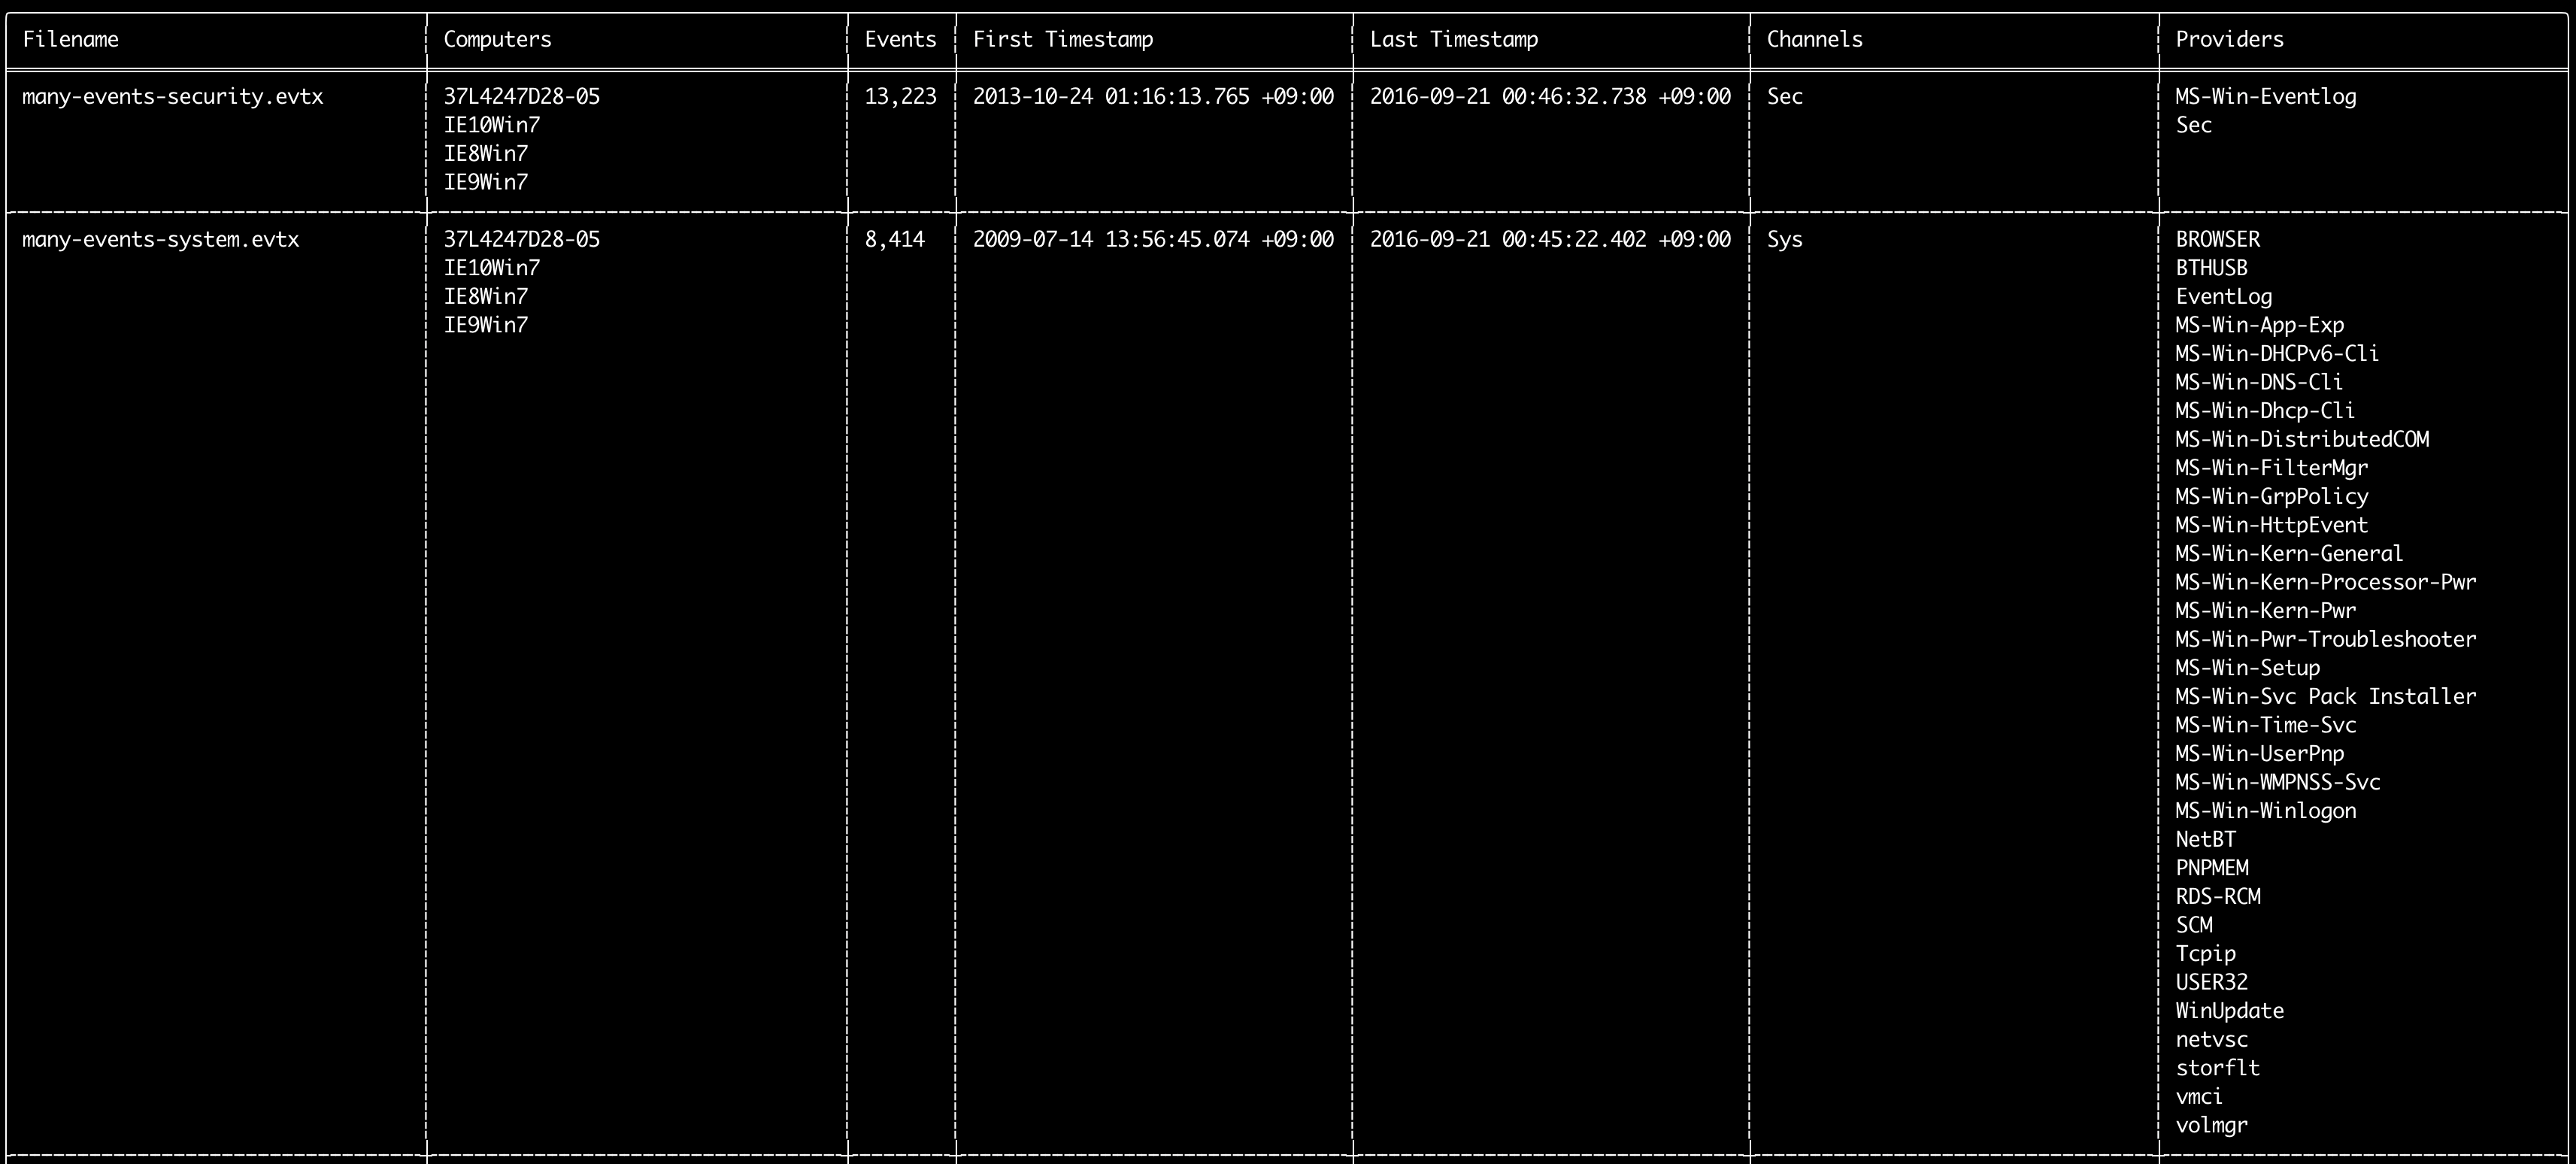
log-metrics 명령어를 사용하면 이벤트 로그 내부의 다음 메타데이터를 출력할 수 있습니다:
* Filename
* Computer names
* Number of events
* First timestamp
* Last timestamp
* Channels
* Providers
이 명령어는 어떠한 탐지 규칙도 사용하지 않으므로 모든 이벤트를 스캔합니다.
Usage: log-metrics <INPUT> [OPTIONS]

Input:
  -d, --directory <DIR>  Directory of multiple .evtx files
  -f, --file <FILE>      File path to one .evtx file
  -l, --live-analysis    Analyze the local C:\Windows\System32\winevt\Logs folder

General Options:
  -C, --clobber                        Overwrite files when saving
  -h, --help                           Show the help menu
  -J, --JSON-input                     Scan JSON formatted logs instead of .evtx (.json or .jsonl)
  -Q, --quiet-errors                   Quiet errors mode: do not save error logs
  -x, --recover-records                Carve evtx records from slack space (default: disabled)
  -c, --rules-config <DIR>             Specify custom rule config directory (default: ./rules/config)
  -t, --threads <NUMBER>               Number of threads (default: optimal number for performance)
      --target-file-ext <FILE-EXT...>  Specify additional evtx file extensions (ex: evtx_data)

Filtering:
      --exclude-computer <COMPUTER...>  Do not scan specified computer names (ex: ComputerA) (ex: ComputerA,ComputerB)
      --include-computer <COMPUTER...>  Scan only specified computer names (ex: ComputerA) (ex: ComputerA,ComputerB)
      --time-offset <OFFSET>            Scan recent events based on an offset (ex: 1y, 3M, 30d, 24h, 30m)

Output:
  -b, --disable-abbreviations  Disable abbreviations
  -M, --multiline              Output event field information in multiple rows for CSV output
  -o, --output <FILE>          Save the Metrics in CSV format (ex: metrics.csv)
  -S, --tab-separator          Separate event field information by tabs

Display Settings:
  -K, --no-color  Disable color output
  -q, --quiet     Quiet mode: do not display the launch banner
  -v, --verbose   Output verbose information

Time Format:
      --European-time     Output timestamp in European time format (ex: 22-02-2022 22:00:00.123 +02:00)
  -O, --ISO-8601          Output timestamp in original ISO-8601 format (ex: 2022-02-22T10:10:10.1234567Z) (Always UTC)
      --RFC-2822          Output timestamp in RFC 2822 format (ex: Fri, 22 Feb 2022 22:00:00 -0600)
      --RFC-3339          Output timestamp in RFC 3339 format (ex: 2022-02-22 22:00:00.123456-06:00)
      --US-military-time  Output timestamp in US military time format (ex: 02-22-2022 22:00:00.123 -06:00)
      --US-time           Output timestamp in US time format (ex: 02-22-2022 10:00:00.123 PM -06:00)
  -U, --UTC               Output time in UTC format (default: local time)
log-metrics 명령어 예시
- 단일 파일에서 이벤트 ID 메트릭 출력:
hayabusa.exe log-metrics -f Security.evtx - 디렉터리에서 이벤트 ID 메트릭 출력:
hayabusa.exe log-metrics -d ../logs - 결과를 CSV 파일로 저장:
hayabusa.exe log-metrics -d ../logs -o eid-metrics.csv
log-metrics 스크린샷
logon-summary 명령어
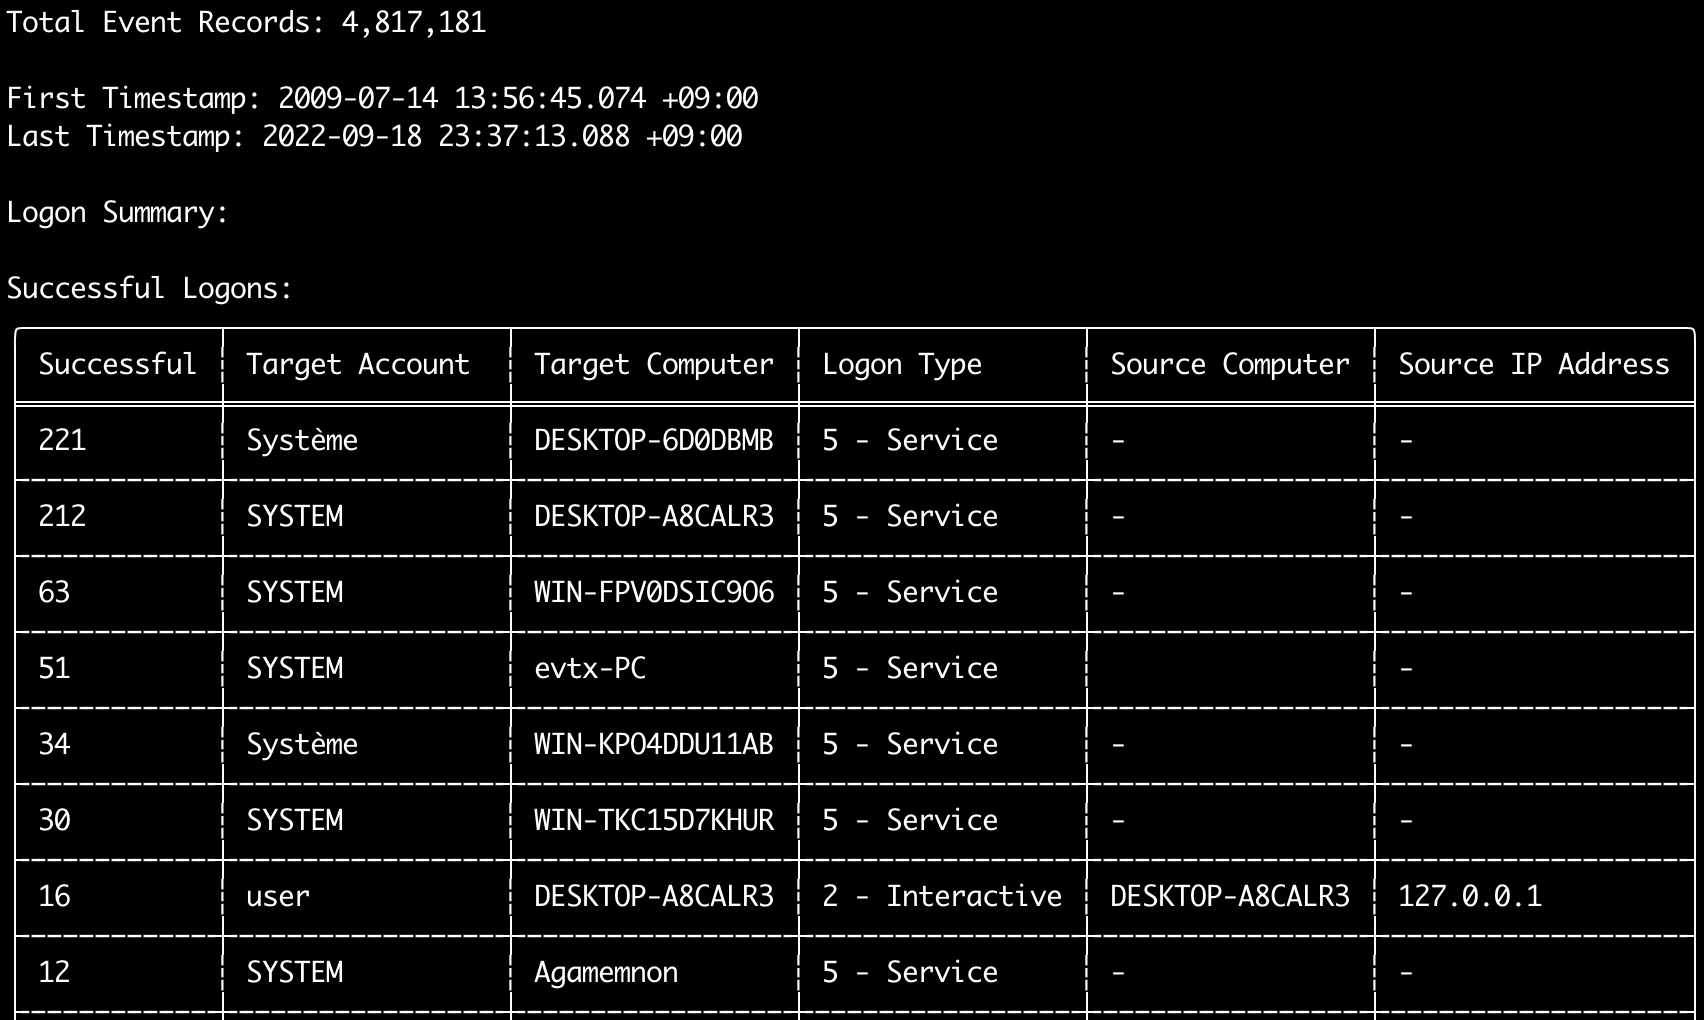
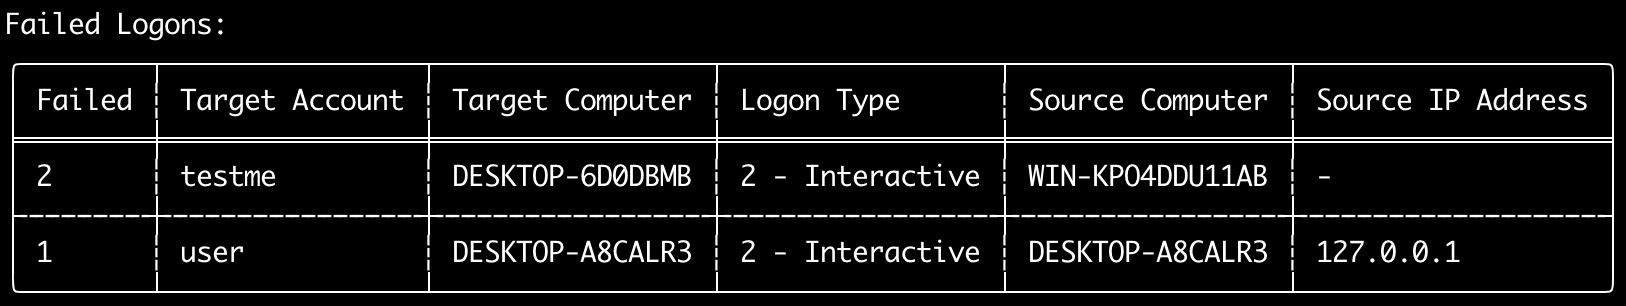
logon-summary 명령어를 사용하면 로그온 정보 요약(로그온 사용자 이름과 성공 및 실패한 로그온 횟수)을 출력할 수 있습니다.
-f 옵션으로 하나의 evtx 파일에 대한 로그온 정보를, -d 옵션으로 여러 evtx 파일에 대한 로그온 정보를 표시할 수 있습니다.
성공한 로그온은 다음 이벤트에서 가져옵니다:
* Security 4624 (로그온 성공)
* RDS-LSM 21 (원격 데스크톱 서비스 로컬 세션 관리자 로그온)
* RDS-GTW 302 (원격 데스크톱 서비스 게이트웨이 로그온)
실패한 로그온은 Security 4625 이벤트에서 가져옵니다.
Usage: logon-summary <INPUT> [OPTIONS]

Input:
  -d, --directory <DIR>  Directory of multiple .evtx files
  -f, --file <FILE>      File path to one .evtx file
  -l, --live-analysis    Analyze the local C:\Windows\System32\winevt\Logs folder

General Options:
  -C, --clobber                        Overwrite files when saving
  -h, --help                           Show the help menu
  -J, --JSON-input                     Scan JSON formatted logs instead of .evtx (.json or .jsonl)
  -Q, --quiet-errors                   Quiet errors mode: do not save error logs
  -x, --recover-records                Carve evtx records from slack space (default: disabled)
  -c, --rules-config <DIR>             Specify custom rule config directory (default: ./rules/config)
  -t, --threads <NUMBER>               Number of threads (default: optimal number for performance)
      --target-file-ext <FILE-EXT...>  Specify additional evtx file extensions (ex: evtx_data)

Filtering:
      --exclude-computer <COMPUTER...>  Do not scan specified computer names (ex: ComputerA) (ex: ComputerA,ComputerB)
      --include-computer <COMPUTER...>  Scan only specified computer names (ex: ComputerA) (ex: ComputerA,ComputerB)
      --time-offset <OFFSET>            Scan recent events based on an offset (ex: 1y, 3M, 30d, 24h, 30m)
      --timeline-end <DATE>             End time of the event logs to load (ex: "2022-02-22 23:59:59 +09:00")
      --timeline-start <DATE>           Start time of the event logs to load (ex: "2020-02-22 00:00:00 +09:00")

Output:
  -o, --output <FILENAME-PREFIX>  Save the logon summary to two CSV files (ex: -o logon-summary)

Display Settings:
  -K, --no-color  Disable color output
  -q, --quiet     Quiet mode: do not display the launch banner
  -v, --verbose   Output verbose information

Time Format:
      --European-time     Output timestamp in European time format (ex: 22-02-2022 22:00:00.123 +02:00)
  -O, --ISO-8601          Output timestamp in original ISO-8601 format (ex: 2022-02-22T10:10:10.1234567Z) (Always UTC)
      --RFC-2822          Output timestamp in RFC 2822 format (ex: Fri, 22 Feb 2022 22:00:00 -0600)
      --RFC-3339          Output timestamp in RFC 3339 format (ex: 2022-02-22 22:00:00.123456-06:00)
      --US-military-time  Output timestamp in US military time format (ex: 02-22-2022 22:00:00.123 -06:00)
      --US-time           Output timestamp in US time format (ex: 02-22-2022 10:00:00.123 PM -06:00)
  -U, --UTC               Output time in UTC format (default: local time)
logon-summary 명령어 예시
- 로그온 요약 출력:
hayabusa.exe logon-summary -f Security.evtx - 로그온 요약 결과 저장:
hayabusa.exe logon-summary -d ../logs -o logon-summary.csv
logon-summary 스크린샷
pivot-keywords-list 명령어
pivot-keywords-list 명령어를 사용하면 비정상적인 사용자, 호스트 이름, 프로세스 등을 빠르게 식별하고 이벤트를 상관 분석하기 위한 고유한 피벗 키워드 목록을 만들 수 있습니다.
중요: 기본적으로 hayabusa는 모든 이벤트(정보 수준 이상)에서 결과를 반환하므로, pivot-keywords-list 명령어를 -m, --min-level 옵션과 함께 사용할 것을 강력히 권장합니다.
예를 들어, -m critical로 critical 알림에서만 키워드를 생성하는 것으로 시작한 다음 -m high, -m medium 등으로 계속 진행하십시오.
결과에는 많은 정상 이벤트와 일치하는 공통 키워드가 있을 가능성이 높으므로, 결과를 수동으로 확인하고 고유한 키워드 목록을 하나의 파일에 만든 후, grep -f keywords.txt timeline.csv와 같은 명령어로 의심스러운 활동의 좁혀진 타임라인을 생성할 수 있습니다.
Usage: pivot-keywords-list <INPUT> [OPTIONS]

Input:
  -d, --directory <DIR>  Directory of multiple .evtx files
  -f, --file <FILE>      File path to one .evtx file
  -l, --live-analysis    Analyze the local C:\Windows\System32\winevt\Logs folder

General Options:
  -C, --clobber                        Overwrite files when saving
  -h, --help                           Show the help menu
  -J, --JSON-input                     Scan JSON formatted logs instead of .evtx (.json or .jsonl)
  -w, --no-wizard                      Do not ask questions. Scan for all events and alerts
  -Q, --quiet-errors                   Quiet errors mode: do not save error logs
  -x, --recover-records                Carve evtx records from slack space (default: disabled)
  -c, --rules-config <DIR>             Specify custom rule config directory (default: ./rules/config)
  -t, --threads <NUMBER>               Number of threads (default: optimal number for performance)
      --target-file-ext <FILE-EXT...>  Specify additional evtx file extensions (ex: evtx_data)

Filtering:
  -E, --EID-filter                      Scan only common EIDs for faster speed (./rules/config/target_event_IDs.txt)
  -D, --enable-deprecated-rules         Enable rules with a status of deprecated
  -n, --enable-noisy-rules              Enable rules set to noisy (./rules/config/noisy_rules.txt)
  -u, --enable-unsupported-rules        Enable rules with a status of unsupported
  -e, --exact-level <LEVEL>             Only load rules with a specific level (informational, low, medium, high, critical)
      --exclude-computer <COMPUTER...>  Do not scan specified computer names (ex: ComputerA) (ex: ComputerA,ComputerB)
      --exclude-eid <EID...>            Do not scan specific EIDs for faster speed (ex: 1) (ex: 1,4688)
      --exclude-status <STATUS...>      Do not load rules according to status (ex: experimental) (ex: stable,test)
      --exclude-tag <TAG...>            Do not load rules with specific tags (ex: sysmon)
      --include-computer <COMPUTER...>  Scan only specified computer names (ex: ComputerA) (ex: ComputerA,ComputerB)
      --include-eid <EID...>            Scan only specified EIDs for faster speed (ex: 1) (ex: 1,4688)
      --include-status <STATUS...>      Only load rules with specific status (ex: experimental) (ex: stable,test)
      --include-tag <TAG...>            Only load rules with specific tags (ex: attack.execution,attack.discovery)
  -m, --min-level <LEVEL>               Minimum level for rules to load (default: informational)
      --time-offset <OFFSET>            Scan recent events based on an offset (ex: 1y, 3M, 30d, 24h, 30m)
      --timeline-end <DATE>             End time of the event logs to load (ex: "2022-02-22 23:59:59 +09:00")
      --timeline-start <DATE>           Start time of the event logs to load (ex: "2020-02-22 00:00:00 +09:00")

Output:
  -o, --output <FILENAME-PREFIX>  Save pivot words to separate files (ex: PivotKeywords)

Display Settings:
  -K, --no-color  Disable color output
  -q, --quiet     Quiet mode: do not display the launch banner
  -v, --verbose   Output verbose information
pivot-keywords-list 명령어 예시
- 피벗 키워드를 화면에 출력:
hayabusa.exe pivot-keywords-list -d ../logs -m critical - critical 알림에서 피벗 키워드 목록을 만들고 결과를 저장합니다. (결과는
keywords-Ip Addresses.txt,keywords-Users.txt등에 저장됩니다):
pivot-keywords-list 설정 파일
./rules/config/pivot_keywords.txt를 편집하여 검색하려는 키워드를 사용자 정의할 수 있습니다.
이 페이지가 기본 설정입니다.
형식은 KeywordName.FieldName입니다. 예를 들어, Users 목록을 만들 때 hayabusa는 SubjectUserName, TargetUserName 및 User 필드의 모든 값을 나열합니다.
search 명령어
search 명령어를 사용하면 모든 이벤트에 대해 키워드 검색을 할 수 있습니다.
(Hayabusa 탐지 결과뿐만 아니라.)
이는 Hayabusa가 탐지하지 못한 이벤트에 증거가 있는지 판단하는 데 유용합니다.
Usage: hayabusa.exe search <INPUT> <--keywords "<KEYWORDS>" OR --regex "<REGEX>"> [OPTIONS]

Display Settings:
  -K, --no-color  Disable color output
  -q, --quiet     Quiet mode: do not display the launch banner
  -v, --verbose   Output verbose information

General Options:
  -C, --clobber                        Overwrite files when saving
  -h, --help                           Show the help menu
  -Q, --quiet-errors                   Quiet errors mode: do not save error logs
  -x, --recover-records                Carve evtx records from slack space (default: disabled)
  -c, --rules-config <DIR>             Specify custom rule config directory (default: ./rules/config)
  -t, --threads <NUMBER>               Number of threads (default: optimal number for performance)
      --target-file-ext <FILE-EXT...>  Specify additional evtx file extensions (ex: evtx_data)
  -s, --sort                           Sort results before saving the file (warning: this uses much more memory!)

Input:
  -d, --directory <DIR>  Directory of multiple .evtx files
  -f, --file <FILE>      File path to one .evtx file
  -l, --live-analysis    Analyze the local C:\Windows\System32\winevt\Logs folder

Filtering:
  -a, --and-logic              Search keywords with AND logic (default: OR)
  -F, --filter <FILTER...>     Filter by specific field(s)
  -i, --ignore-case            Case-insensitive keyword search
  -k, --keyword <KEYWORD...>   Search by keyword(s)
  -r, --regex <REGEX>          Search by regular expression
      --time-offset <OFFSET>   Scan recent events based on an offset (ex: 1y, 3M, 30d, 24h, 30m)
      --timeline-end <DATE>    End time of the event logs to load (ex: "2022-02-22 23:59:59 +09:00")
      --timeline-start <DATE>  Start time of the event logs to load (ex: "2020-02-22 00:00:00 +09:00")

Output:
  -b, --disable-abbreviations  Disable abbreviations
  -J, --JSON-output            Save the search results in JSON format (ex: -J -o results.json)
  -L, --JSONL-output           Save the search results in JSONL format (ex: -L -o results.jsonl)
  -M, --multiline              Output event field information in multiple rows for CSV output
  -o, --output <FILE>          Save the search results in CSV format (ex: search.csv)
  -S, --tab-separator          Separate event field information by tabs

Time Format:
      --European-time     Output timestamp in European time format (ex: 22-02-2022 22:00:00.123 +02:00)
  -O, --ISO-8601          Output timestamp in original ISO-8601 format (ex: 2022-02-22T10:10:10.1234567Z) (Always UTC)
      --RFC-2822          Output timestamp in RFC 2822 format (ex: Fri, 22 Feb 2022 22:00:00 -0600)
      --RFC-3339          Output timestamp in RFC 3339 format (ex: 2022-02-22 22:00:00.123456-06:00)
      --US-military-time  Output timestamp in US military time format (ex: 02-22-2022 22:00:00.123 -06:00)
      --US-time           Output timestamp in US time format (ex: 02-22-2022 10:00:00.123 PM -06:00)
  -U, --UTC               Output time in UTC format (default: local time)
search 명령어 예시
../hayabusa-sample-evtx디렉터리에서 키워드mimikatz검색:
참고: 데이터 어디에서든
mimikatz가 발견되면 키워드가 일치합니다. 정확히 일치하는 것은 아닙니다.
../hayabusa-sample-evtx디렉터리에서 키워드mimikatz또는kali검색:
../hayabusa-sample-evtx디렉터리에서 대소문자를 무시하고 키워드mimikatz검색:
- 정규식을 사용하여
../hayabusa-sample-evtx디렉터리에서 IP 주소 검색:
../hayabusa-sample-evtx디렉터리를 검색하여WorkstationName필드가kali인 모든 이벤트 표시:
참고:
.*는 모든 이벤트와 일치하는 정규식입니다.
search 명령어 설정 파일
./rules/config/channel_abbreviations.txt: 채널 이름과 그 약어의 매핑.