Analysebefehle
Befehl computer-metrics
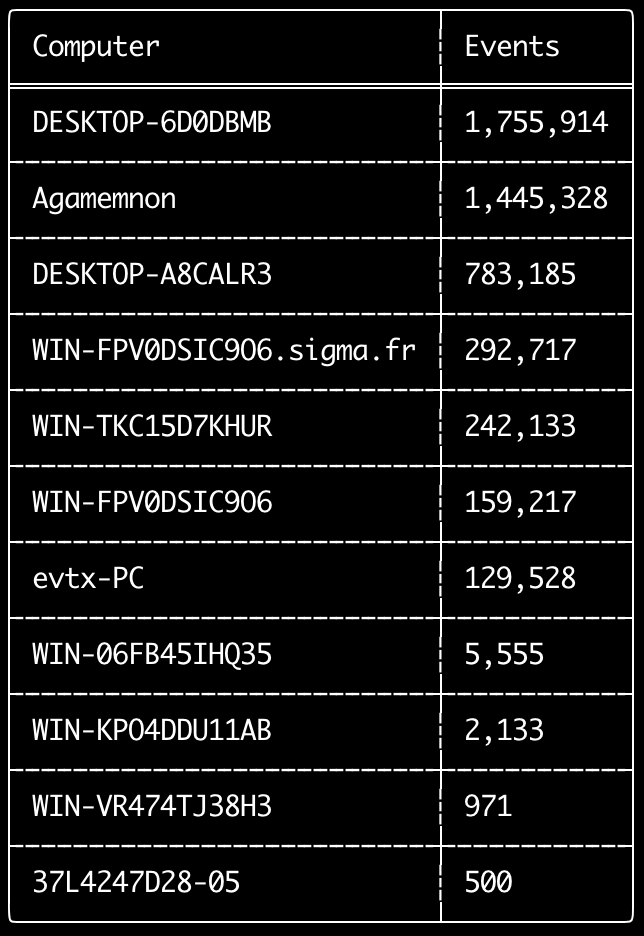
Sie können den Befehl computer-metrics verwenden, um zu überprüfen, wie viele Ereignisse es gemäß jedem im Feld <System><Computer> definierten Computer gibt.
Beachten Sie, dass Sie sich nicht vollständig auf das Feld Computer verlassen können, um Ereignisse nach ihrem ursprünglichen Computer zu trennen.
Windows 11 verwendet beim Speichern in Ereignisprotokollen manchmal völlig andere Computer-Namen.
Außerdem zeichnet Windows 10 den Computer-Namen manchmal vollständig in Kleinbuchstaben auf.
Dieser Befehl verwendet keine Erkennungsregeln und analysiert daher alle Ereignisse.
Dies ist ein guter Befehl, um schnell zu sehen, welche Computer die meisten Protokolle haben.
Mit diesen Informationen können Sie dann beim Erstellen Ihrer Zeitleisten die Optionen --include-computer oder --exclude-computer verwenden, um Ihre Zeitleistenerstellung effizienter zu gestalten, indem Sie mehrere Zeitleisten nach Computer erstellen oder Ereignisse von bestimmten Computern ausschließen.
Usage: computer-metrics <INPUT> [OPTIONS]

Input:
  -d, --directory <DIR>  Directory of multiple .evtx files
  -f, --file <FILE>      File path to one .evtx file
  -l, --live-analysis    Analyze the local C:\Windows\System32\winevt\Logs folder

General Options:
  -C, --clobber                        Overwrite files when saving
  -h, --help                           Show the help menu
  -J, --JSON-input                     Scan JSON formatted logs instead of .evtx (.json or .jsonl)
  -Q, --quiet-errors                   Quiet errors mode: do not save error logs
  -x, --recover-records                Carve evtx records from slack space (default: disabled)
  -c, --rules-config <DIR>             Specify custom rule config directory (default: ./rules/config)
      --target-file-ext <FILE-EXT...>  Specify additional evtx file extensions (ex: evtx_data)
  -t, --threads <NUMBER>               Number of threads (default: optimal number for performance)

Filtering:
      --time-offset <OFFSET>  Scan recent events based on an offset (ex: 1y, 3M, 30d, 24h, 30m)

Output:
  -o, --output <FILE>  Save the results in CSV format (ex: computer-metrics.csv)

Display Settings:
  -K, --no-color  Disable color output
  -q, --quiet     Quiet mode: do not display the launch banner
  -v, --verbose   Output verbose information
Beispiele für den Befehl computer-metrics
- Computernamen-Metriken aus einem Verzeichnis ausgeben:
hayabusa.exe computer-metrics -d ../logs - Ergebnisse in einer CSV-Datei speichern:
hayabusa.exe computer-metrics -d ../logs -o computer-metrics.csv
Screenshot von computer-metrics
Befehl eid-metrics
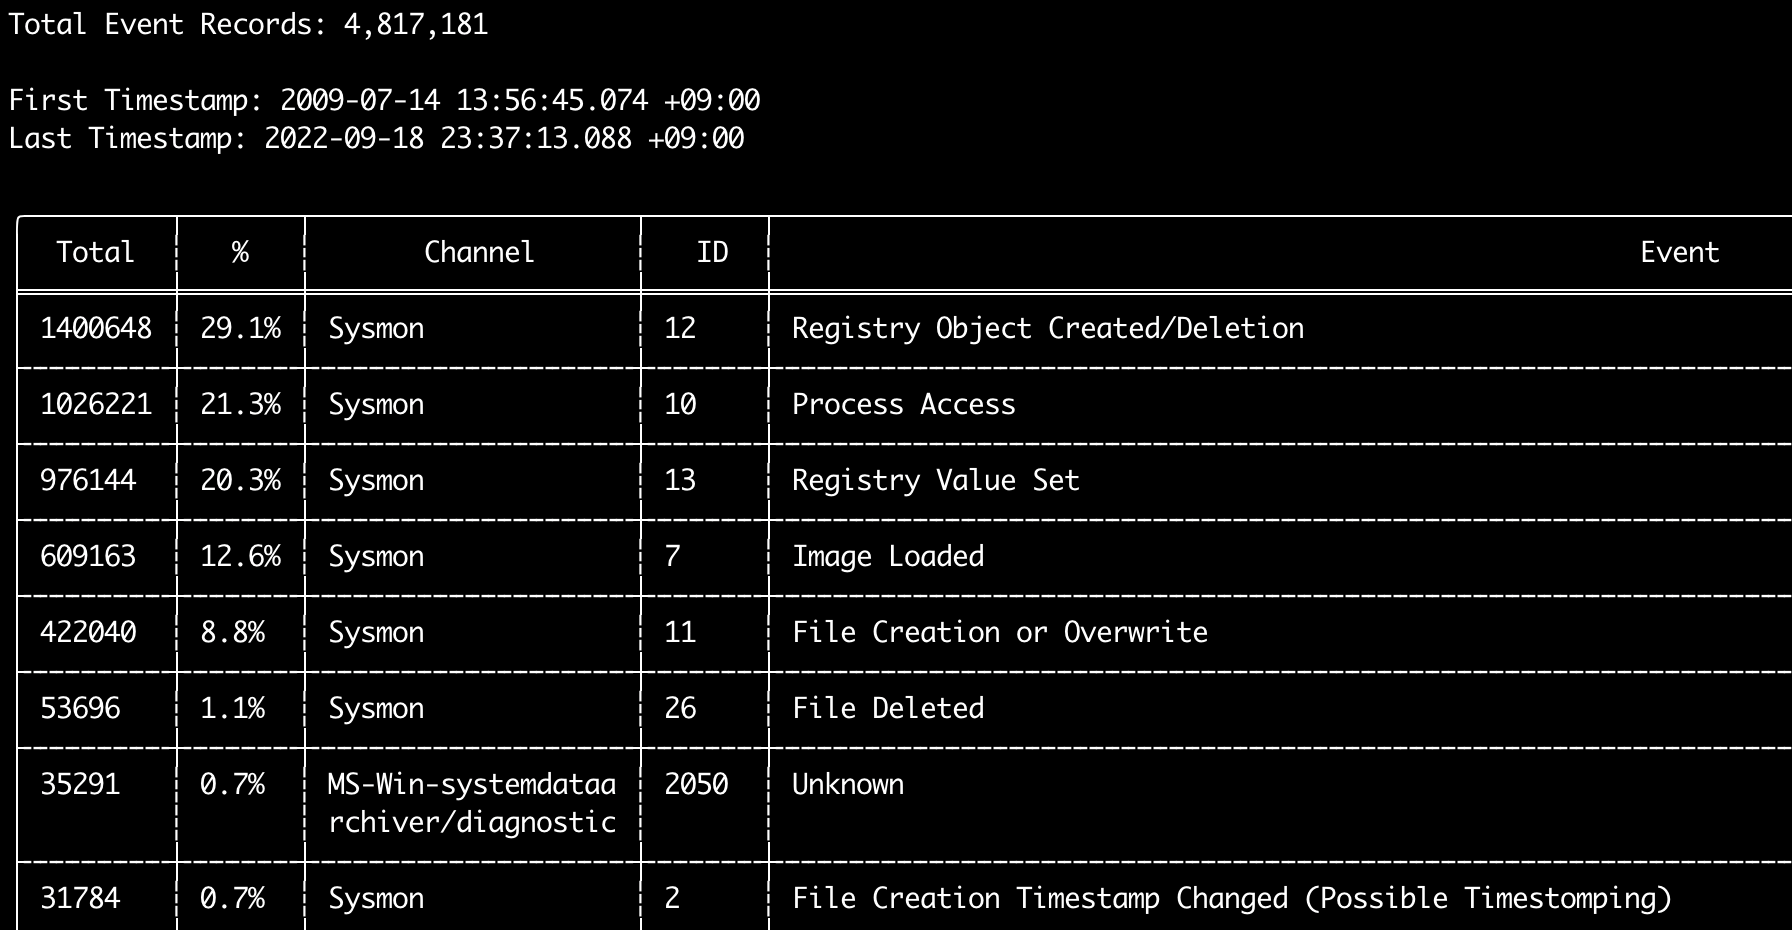
Sie können den Befehl eid-metrics verwenden, um die Gesamtzahl und den Prozentsatz der Ereignis-IDs (Feld <System><EventID>) getrennt nach Kanälen auszugeben.
Dieser Befehl verwendet keine Erkennungsregeln und durchsucht daher alle Ereignisse.
Usage: eid-metrics <INPUT> [OPTIONS]

Input:
  -d, --directory <DIR>  Directory of multiple .evtx files
  -f, --file <FILE>      File path to one .evtx file
  -l, --live-analysis    Analyze the local C:\Windows\System32\winevt\Logs folder

General Options:
  -C, --clobber                        Overwrite files when saving
  -h, --help                           Show the help menu
  -J, --JSON-input                     Scan JSON formatted logs instead of .evtx (.json or .jsonl)
  -Q, --quiet-errors                   Quiet errors mode: do not save error logs
  -x, --recover-records                Carve evtx records from slack space (default: disabled)
  -c, --rules-config <DIR>             Specify custom rule config directory (default: ./rules/config)
  -t, --threads <NUMBER>               Number of threads (default: optimal number for performance)
      --target-file-ext <FILE-EXT...>  Specify additional evtx file extensions (ex: evtx_data)

Filtering:
      --exclude-computer <COMPUTER...>  Do not scan specified computer names (ex: ComputerA) (ex: ComputerA,ComputerB)
      --include-computer <COMPUTER...>  Scan only specified computer names (ex: ComputerA) (ex: ComputerA,ComputerB)
      --time-offset <OFFSET>            Scan recent events based on an offset (ex: 1y, 3M, 30d, 24h, 30m)

Output:
  -b, --disable-abbreviations  Disable abbreviations
  -o, --output <FILE>          Save the Metrics in CSV format (ex: metrics.csv)

Display Settings:
  -K, --no-color  Disable color output
  -q, --quiet     Quiet mode: do not display the launch banner
  -v, --verbose   Output verbose information

Time Format:
      --European-time     Output timestamp in European time format (ex: 22-02-2022 22:00:00.123 +02:00)
  -O, --ISO-8601          Output timestamp in original ISO-8601 format (ex: 2022-02-22T10:10:10.1234567Z) (Always UTC)
      --RFC-2822          Output timestamp in RFC 2822 format (ex: Fri, 22 Feb 2022 22:00:00 -0600)
      --RFC-3339          Output timestamp in RFC 3339 format (ex: 2022-02-22 22:00:00.123456-06:00)
      --US-military-time  Output timestamp in US military time format (ex: 02-22-2022 22:00:00.123 -06:00)
      --US-time           Output timestamp in US time format (ex: 02-22-2022 10:00:00.123 PM -06:00)
  -U, --UTC               Output time in UTC format (default: local time)
Beispiele für den Befehl eid-metrics
- Ereignis-ID-Metriken aus einer einzelnen Datei ausgeben:
hayabusa.exe eid-metrics -f Security.evtx - Ereignis-ID-Metriken aus einem Verzeichnis ausgeben:
hayabusa.exe eid-metrics -d ../logs - Ergebnisse in einer CSV-Datei speichern:
hayabusa.exe eid-metrics -f Security.evtx -o eid-metrics.csv
Konfigurationsdatei für den Befehl eid-metrics
Der Kanal, die Ereignis-IDs und die Titel der Ereignisse sind in rules/config/channel_eid_info.txt definiert.
Beispiel:
Channel,EventID,EventTitle
Microsoft-Windows-Sysmon/Operational,1,Process Creation.
Microsoft-Windows-Sysmon/Operational,2,File Creation Timestamp Changed. (Possible Timestomping)
Microsoft-Windows-Sysmon/Operational,3,Network Connection.
Microsoft-Windows-Sysmon/Operational,4,Sysmon Service State Changed.
Screenshot von eid-metrics
Befehl expand-list
Extrahiert expand-Platzhalter aus dem Regelordner.
Dies ist nützlich beim Erstellen von Konfigurationsdateien, um eine Regel zu verwenden, die den Feldmodifikator expand nutzt.
Um expand-Regeln zu verwenden, müssen Sie lediglich eine .txt-Datei mit dem Namen des expand-Feldmodifikators im Verzeichnis ./config/expand/ erstellen und alle Werte einfügen, die Sie überprüfen möchten.
Wenn beispielsweise die detection-Logik der Regel lautet:
detection:
    selection:
        EventID: 5145
        RelativeTargetName|contains: '\winreg'
    filter_main:
        IpAddress|expand: '%Admins_Workstations%'
    condition: selection and not filter_main
würden Sie die Textdatei ./config/expand/Admins_Workstations.txt erstellen und Werte wie folgt einfügen:
Dies würde im Wesentlichen dieselbe Logik überprüfen wie:
Wenn die Konfigurationsdatei nicht existiert, lädt Hayabusa die expand-Regel zwar weiterhin, ignoriert sie aber.
Usage:  expand-list <INPUT> [OPTIONS]

General Options:
  -h, --help              Show the help menu
  -r, --rules <DIR/FILE>  Specify rule directory (default: ./rules)

Display Settings:
  -K, --no-color  Disable color output
  -q, --quiet     Quiet mode: do not display the launch banner
Beispiele für den Befehl expand-list
expand-Feldmodifikatoren aus dem Standardverzeichnisrulesextrahieren:hayabusa.exe expand-listexpand-Feldmodifikatoren aus dem Verzeichnissigmaextrahieren:hayabusa.exe eid-metrics -r ../sigma
Ergebnisse von expand-list
5 unique expand placeholders found:
Admins_Workstations
DC-MACHINE-NAME
Workstations
internal_domains
domain_controller_hostnames
Befehl extract-base64
Dieser Befehl extrahiert Base64-Zeichenfolgen aus den folgenden Ereignissen, dekodiert sie und gibt an, welche Art von Kodierung verwendet wird. * Security 4688 CommandLine * Sysmon 1 CommandLine, ParentCommandLine * System 7045 ImagePath * PowerShell Operational 4104 * PowerShell Operational 4103
Usage:  extract-base64 <INPUT> [OPTIONS]

Input:
  -d, --directory <DIR>  Directory of multiple .evtx files
  -f, --file <FILE>      File path to one .evtx file
  -l, --live-analysis    Analyze the local C:\Windows\System32\winevt\Logs folder

General Options:
  -C, --clobber                        Overwrite files when saving
  -h, --help                           Show the help menu
  -J, --JSON-input                     Scan JSON formatted logs instead of .evtx (.json or .jsonl)
  -Q, --quiet-errors                   Quiet errors mode: do not save error logs
  -x, --recover-records                Carve evtx records from slack space (default: disabled)
  -c, --rules-config <DIR>             Specify custom rule config directory (default: ./rules/config)
  -t, --threads <NUMBER>               Number of threads (default: optimal number for performance)
      --target-file-ext <FILE-EXT...>  Specify additional evtx file extensions (ex: evtx_data)

Filtering:
      --exclude-computer <COMPUTER...>  Do not scan specified computer names (ex: ComputerA) (ex: ComputerA,ComputerB)
      --include-computer <COMPUTER...>  Scan only specified computer names (ex: ComputerA) (ex: ComputerA,ComputerB)
      --time-offset <OFFSET>            Scan recent events based on an offset (ex: 1y, 3M, 30d, 24h, 30m)

Output:
  -o, --output <FILE>  Extract Base64 strings

Display Settings:
  -K, --no-color  Disable color output
  -q, --quiet     Quiet mode: do not display the launch banner
  -v, --verbose   Output verbose information

Time Format:
      --European-time     Output timestamp in European time format (ex: 22-02-2022 22:00:00.123 +02:00)
  -O, --ISO-8601          Output timestamp in original ISO-8601 format (ex: 2022-02-22T10:10:10.1234567Z) (Always UTC)
      --RFC-2822          Output timestamp in RFC 2822 format (ex: Fri, 22 Feb 2022 22:00:00 -0600)
      --RFC-3339          Output timestamp in RFC 3339 format (ex: 2022-02-22 22:00:00.123456-06:00)
      --US-military-time  Output timestamp in US military time format (ex: 02-22-2022 22:00:00.123 -06:00)
      --US-time           Output timestamp in US time format (ex: 02-22-2022 10:00:00.123 PM -06:00)
  -U, --UTC               Output time in UTC format (default: local time)
Beispiele für den Befehl extract-base64
- Ein Verzeichnis durchsuchen und im Terminal ausgeben:
hayabusa.exe extract-base64 -d ../hayabusa-sample-evtx - Ein Verzeichnis durchsuchen und in eine CSV-Datei ausgeben:
hayabusa.exe eid-metrics -r ../sigma -o base64-extracted.csv
Ergebnisse von extract-base64
Bei der Ausgabe im Terminal werden aufgrund des begrenzten Platzes nur die folgenden Felder angezeigt: * Timestamp * Computer * Base64 String * Decoded String (if not binary)
Beim Speichern in einer CSV-Datei werden die folgenden Felder gespeichert:
* Timestamp
* Computer
* Base64 String
* Decoded String (if not binary)
* Original Field
* Length
* Binary (Y/N)
* Double Encoding (when Y, it usually is malicious)
* Encoding Type
* File Type
* Event
* Record ID
* File Name
Befehl log-metrics
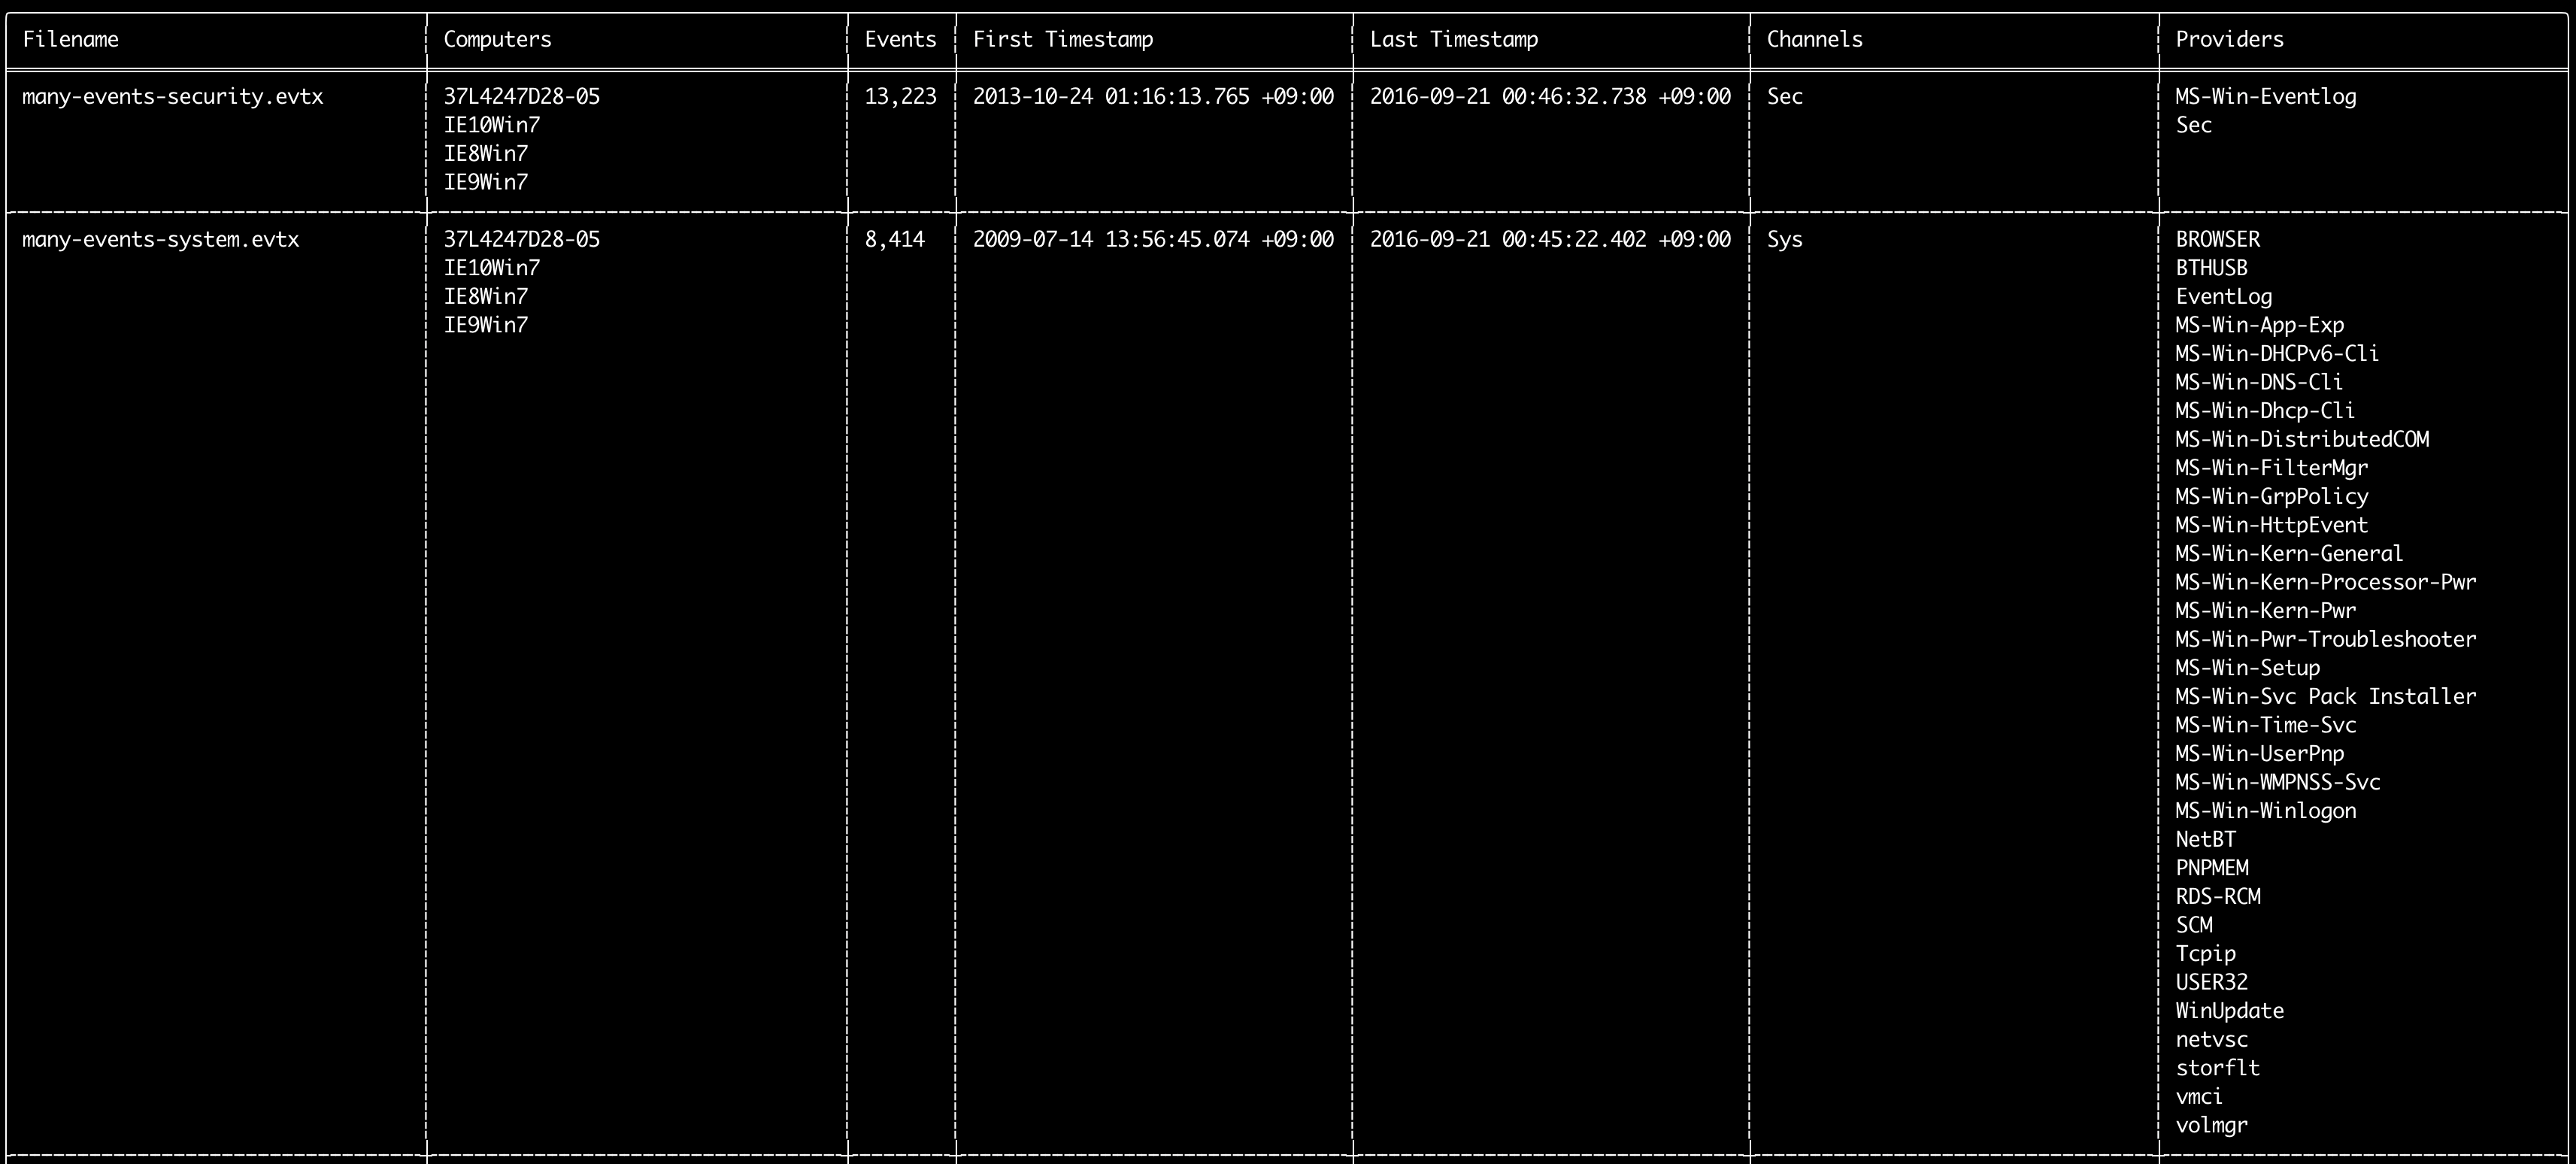
Sie können den Befehl log-metrics verwenden, um die folgenden Metadaten innerhalb von Ereignisprotokollen auszugeben:
* Filename
* Computer names
* Number of events
* First timestamp
* Last timestamp
* Channels
* Providers
Dieser Befehl verwendet keine Erkennungsregeln und durchsucht daher alle Ereignisse.
Usage: log-metrics <INPUT> [OPTIONS]

Input:
  -d, --directory <DIR>  Directory of multiple .evtx files
  -f, --file <FILE>      File path to one .evtx file
  -l, --live-analysis    Analyze the local C:\Windows\System32\winevt\Logs folder

General Options:
  -C, --clobber                        Overwrite files when saving
  -h, --help                           Show the help menu
  -J, --JSON-input                     Scan JSON formatted logs instead of .evtx (.json or .jsonl)
  -Q, --quiet-errors                   Quiet errors mode: do not save error logs
  -x, --recover-records                Carve evtx records from slack space (default: disabled)
  -c, --rules-config <DIR>             Specify custom rule config directory (default: ./rules/config)
  -t, --threads <NUMBER>               Number of threads (default: optimal number for performance)
      --target-file-ext <FILE-EXT...>  Specify additional evtx file extensions (ex: evtx_data)

Filtering:
      --exclude-computer <COMPUTER...>  Do not scan specified computer names (ex: ComputerA) (ex: ComputerA,ComputerB)
      --include-computer <COMPUTER...>  Scan only specified computer names (ex: ComputerA) (ex: ComputerA,ComputerB)
      --time-offset <OFFSET>            Scan recent events based on an offset (ex: 1y, 3M, 30d, 24h, 30m)

Output:
  -b, --disable-abbreviations  Disable abbreviations
  -M, --multiline              Output event field information in multiple rows for CSV output
  -o, --output <FILE>          Save the Metrics in CSV format (ex: metrics.csv)
  -S, --tab-separator          Separate event field information by tabs

Display Settings:
  -K, --no-color  Disable color output
  -q, --quiet     Quiet mode: do not display the launch banner
  -v, --verbose   Output verbose information

Time Format:
      --European-time     Output timestamp in European time format (ex: 22-02-2022 22:00:00.123 +02:00)
  -O, --ISO-8601          Output timestamp in original ISO-8601 format (ex: 2022-02-22T10:10:10.1234567Z) (Always UTC)
      --RFC-2822          Output timestamp in RFC 2822 format (ex: Fri, 22 Feb 2022 22:00:00 -0600)
      --RFC-3339          Output timestamp in RFC 3339 format (ex: 2022-02-22 22:00:00.123456-06:00)
      --US-military-time  Output timestamp in US military time format (ex: 02-22-2022 22:00:00.123 -06:00)
      --US-time           Output timestamp in US time format (ex: 02-22-2022 10:00:00.123 PM -06:00)
  -U, --UTC               Output time in UTC format (default: local time)
Beispiele für den Befehl log-metrics
- Ereignis-ID-Metriken aus einer einzelnen Datei ausgeben:
hayabusa.exe log-metrics -f Security.evtx - Ereignis-ID-Metriken aus einem Verzeichnis ausgeben:
hayabusa.exe log-metrics -d ../logs - Ergebnisse in einer CSV-Datei speichern:
hayabusa.exe log-metrics -d ../logs -o eid-metrics.csv
Screenshot von log-metrics
Befehl logon-summary
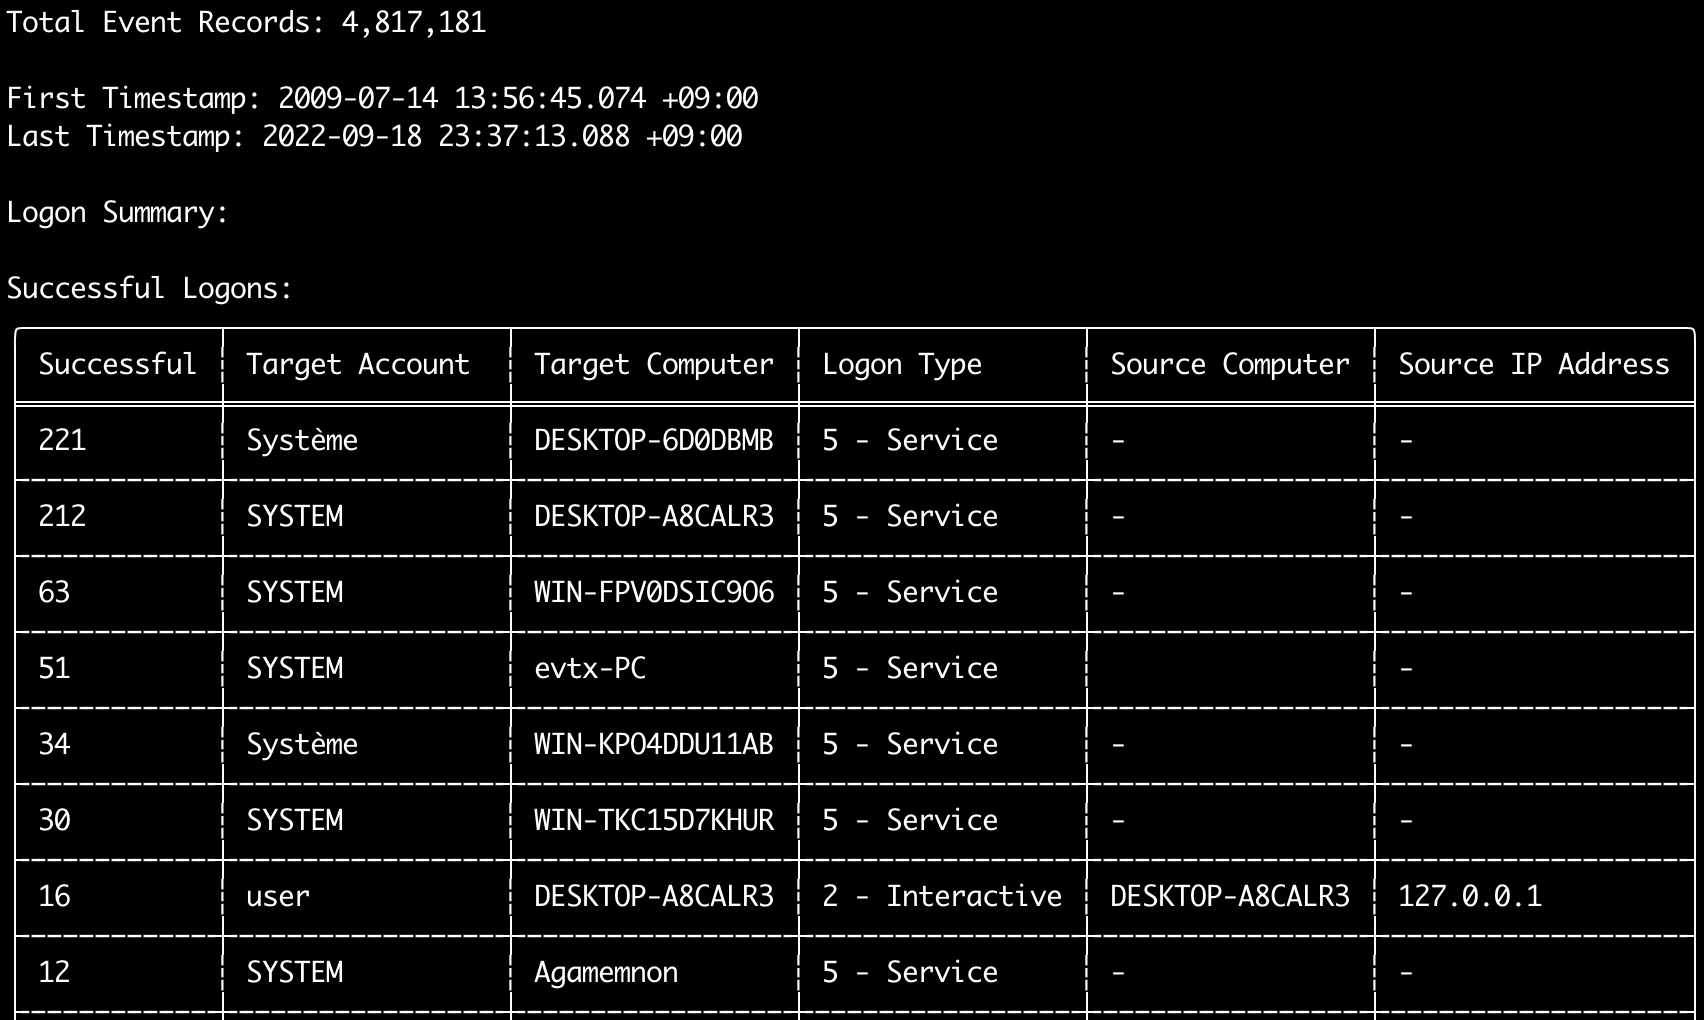
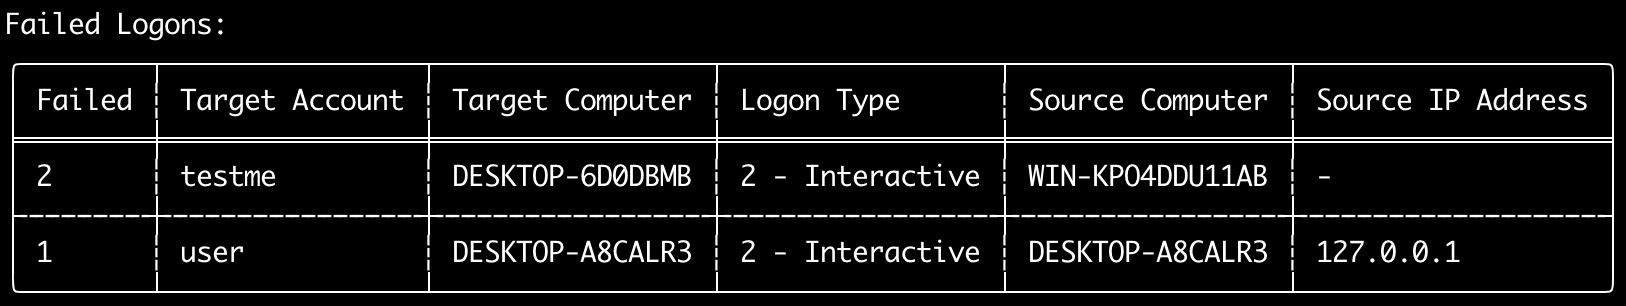
Sie können den Befehl logon-summary verwenden, um eine Zusammenfassung der Anmeldeinformationen auszugeben (Anmelde-Benutzernamen sowie die Anzahl erfolgreicher und fehlgeschlagener Anmeldungen).
Sie können die Anmeldeinformationen für eine evtx-Datei mit -f oder für mehrere evtx-Dateien mit der Option -d anzeigen.
Erfolgreiche Anmeldungen werden aus den folgenden Ereignissen entnommen:
* Security 4624 (Successful Logon)
* RDS-LSM 21 (Remote Desktop Service Local Session Manager Logon)
* RDS-GTW 302 (Remote Desktop Service Gateway Logon)
Fehlgeschlagene Anmeldungen werden aus Security 4625-Ereignissen entnommen.
Usage: logon-summary <INPUT> [OPTIONS]

Input:
  -d, --directory <DIR>  Directory of multiple .evtx files
  -f, --file <FILE>      File path to one .evtx file
  -l, --live-analysis    Analyze the local C:\Windows\System32\winevt\Logs folder

General Options:
  -C, --clobber                        Overwrite files when saving
  -h, --help                           Show the help menu
  -J, --JSON-input                     Scan JSON formatted logs instead of .evtx (.json or .jsonl)
  -Q, --quiet-errors                   Quiet errors mode: do not save error logs
  -x, --recover-records                Carve evtx records from slack space (default: disabled)
  -c, --rules-config <DIR>             Specify custom rule config directory (default: ./rules/config)
  -t, --threads <NUMBER>               Number of threads (default: optimal number for performance)
      --target-file-ext <FILE-EXT...>  Specify additional evtx file extensions (ex: evtx_data)

Filtering:
      --exclude-computer <COMPUTER...>  Do not scan specified computer names (ex: ComputerA) (ex: ComputerA,ComputerB)
      --include-computer <COMPUTER...>  Scan only specified computer names (ex: ComputerA) (ex: ComputerA,ComputerB)
      --time-offset <OFFSET>            Scan recent events based on an offset (ex: 1y, 3M, 30d, 24h, 30m)
      --timeline-end <DATE>             End time of the event logs to load (ex: "2022-02-22 23:59:59 +09:00")
      --timeline-start <DATE>           Start time of the event logs to load (ex: "2020-02-22 00:00:00 +09:00")

Output:
  -o, --output <FILENAME-PREFIX>  Save the logon summary to two CSV files (ex: -o logon-summary)

Display Settings:
  -K, --no-color  Disable color output
  -q, --quiet     Quiet mode: do not display the launch banner
  -v, --verbose   Output verbose information

Time Format:
      --European-time     Output timestamp in European time format (ex: 22-02-2022 22:00:00.123 +02:00)
  -O, --ISO-8601          Output timestamp in original ISO-8601 format (ex: 2022-02-22T10:10:10.1234567Z) (Always UTC)
      --RFC-2822          Output timestamp in RFC 2822 format (ex: Fri, 22 Feb 2022 22:00:00 -0600)
      --RFC-3339          Output timestamp in RFC 3339 format (ex: 2022-02-22 22:00:00.123456-06:00)
      --US-military-time  Output timestamp in US military time format (ex: 02-22-2022 22:00:00.123 -06:00)
      --US-time           Output timestamp in US time format (ex: 02-22-2022 10:00:00.123 PM -06:00)
  -U, --UTC               Output time in UTC format (default: local time)
Beispiele für den Befehl logon-summary
- Anmeldezusammenfassung ausgeben:
hayabusa.exe logon-summary -f Security.evtx - Ergebnisse der Anmeldezusammenfassung speichern:
hayabusa.exe logon-summary -d ../logs -o logon-summary.csv
Screenshots von logon-summary
Befehl pivot-keywords-list
Sie können den Befehl pivot-keywords-list verwenden, um eine Liste eindeutiger Pivot-Schlüsselwörter zu erstellen, mit denen Sie schnell abnormale Benutzer, Hostnamen, Prozesse usw. identifizieren sowie Ereignisse korrelieren können.
Wichtig: Standardmäßig gibt Hayabusa Ergebnisse aus allen Ereignissen (informational und höher) zurück, daher empfehlen wir dringend, den Befehl pivot-keywords-list mit der Option -m, --min-level zu kombinieren.
Beginnen Sie beispielsweise damit, nur Schlüsselwörter aus critical-Alarmen mit -m critical zu erstellen, und fahren Sie dann mit -m high, -m medium usw. fort.
In Ihren Ergebnissen werden höchstwahrscheinlich gängige Schlüsselwörter enthalten sein, die auf viele normale Ereignisse zutreffen. Nachdem Sie die Ergebnisse manuell überprüft und eine Liste eindeutiger Schlüsselwörter in einer einzelnen Datei erstellt haben, können Sie dann mit einem Befehl wie grep -f keywords.txt timeline.csv eine eingegrenzte Zeitleiste verdächtiger Aktivitäten erstellen.
Usage: pivot-keywords-list <INPUT> [OPTIONS]

Input:
  -d, --directory <DIR>  Directory of multiple .evtx files
  -f, --file <FILE>      File path to one .evtx file
  -l, --live-analysis    Analyze the local C:\Windows\System32\winevt\Logs folder

General Options:
  -C, --clobber                        Overwrite files when saving
  -h, --help                           Show the help menu
  -J, --JSON-input                     Scan JSON formatted logs instead of .evtx (.json or .jsonl)
  -w, --no-wizard                      Do not ask questions. Scan for all events and alerts
  -Q, --quiet-errors                   Quiet errors mode: do not save error logs
  -x, --recover-records                Carve evtx records from slack space (default: disabled)
  -c, --rules-config <DIR>             Specify custom rule config directory (default: ./rules/config)
  -t, --threads <NUMBER>               Number of threads (default: optimal number for performance)
      --target-file-ext <FILE-EXT...>  Specify additional evtx file extensions (ex: evtx_data)

Filtering:
  -E, --EID-filter                      Scan only common EIDs for faster speed (./rules/config/target_event_IDs.txt)
  -D, --enable-deprecated-rules         Enable rules with a status of deprecated
  -n, --enable-noisy-rules              Enable rules set to noisy (./rules/config/noisy_rules.txt)
  -u, --enable-unsupported-rules        Enable rules with a status of unsupported
  -e, --exact-level <LEVEL>             Only load rules with a specific level (informational, low, medium, high, critical)
      --exclude-computer <COMPUTER...>  Do not scan specified computer names (ex: ComputerA) (ex: ComputerA,ComputerB)
      --exclude-eid <EID...>            Do not scan specific EIDs for faster speed (ex: 1) (ex: 1,4688)
      --exclude-status <STATUS...>      Do not load rules according to status (ex: experimental) (ex: stable,test)
      --exclude-tag <TAG...>            Do not load rules with specific tags (ex: sysmon)
      --include-computer <COMPUTER...>  Scan only specified computer names (ex: ComputerA) (ex: ComputerA,ComputerB)
      --include-eid <EID...>            Scan only specified EIDs for faster speed (ex: 1) (ex: 1,4688)
      --include-status <STATUS...>      Only load rules with specific status (ex: experimental) (ex: stable,test)
      --include-tag <TAG...>            Only load rules with specific tags (ex: attack.execution,attack.discovery)
  -m, --min-level <LEVEL>               Minimum level for rules to load (default: informational)
      --time-offset <OFFSET>            Scan recent events based on an offset (ex: 1y, 3M, 30d, 24h, 30m)
      --timeline-end <DATE>             End time of the event logs to load (ex: "2022-02-22 23:59:59 +09:00")
      --timeline-start <DATE>           Start time of the event logs to load (ex: "2020-02-22 00:00:00 +09:00")

Output:
  -o, --output <FILENAME-PREFIX>  Save pivot words to separate files (ex: PivotKeywords)

Display Settings:
  -K, --no-color  Disable color output
  -q, --quiet     Quiet mode: do not display the launch banner
  -v, --verbose   Output verbose information
Beispiele für den Befehl pivot-keywords-list
- Pivot-Schlüsselwörter auf dem Bildschirm ausgeben:
hayabusa.exe pivot-keywords-list -d ../logs -m critical - Eine Liste von Pivot-Schlüsselwörtern aus kritischen Alarmen erstellen und die Ergebnisse speichern. (Die Ergebnisse werden in
keywords-Ip Addresses.txt,keywords-Users.txtusw. gespeichert):
Konfigurationsdatei für den Befehl pivot-keywords-list
Sie können anpassen, nach welchen Schlüsselwörtern Sie suchen möchten, indem Sie ./rules/config/pivot_keywords.txt bearbeiten.
Diese Seite enthält die Standardeinstellung.
Das Format ist KeywordName.FieldName. Beim Erstellen der Liste von Users listet Hayabusa beispielsweise alle Werte in den Feldern SubjectUserName, TargetUserName und User auf.
Befehl search
Mit dem Befehl search können Sie eine Schlüsselwortsuche über alle Ereignisse durchführen.
(Nicht nur über die Hayabusa-Erkennungsergebnisse.)
Dies ist nützlich, um festzustellen, ob es in Ereignissen, die von Hayabusa nicht erkannt werden, Beweise gibt.
Usage: hayabusa.exe search <INPUT> <--keywords "<KEYWORDS>" OR --regex "<REGEX>"> [OPTIONS]

Display Settings:
  -K, --no-color  Disable color output
  -q, --quiet     Quiet mode: do not display the launch banner
  -v, --verbose   Output verbose information

General Options:
  -C, --clobber                        Overwrite files when saving
  -h, --help                           Show the help menu
  -Q, --quiet-errors                   Quiet errors mode: do not save error logs
  -x, --recover-records                Carve evtx records from slack space (default: disabled)
  -c, --rules-config <DIR>             Specify custom rule config directory (default: ./rules/config)
  -t, --threads <NUMBER>               Number of threads (default: optimal number for performance)
      --target-file-ext <FILE-EXT...>  Specify additional evtx file extensions (ex: evtx_data)
  -s, --sort                           Sort results before saving the file (warning: this uses much more memory!)

Input:
  -d, --directory <DIR>  Directory of multiple .evtx files
  -f, --file <FILE>      File path to one .evtx file
  -l, --live-analysis    Analyze the local C:\Windows\System32\winevt\Logs folder

Filtering:
  -a, --and-logic              Search keywords with AND logic (default: OR)
  -F, --filter <FILTER...>     Filter by specific field(s)
  -i, --ignore-case            Case-insensitive keyword search
  -k, --keyword <KEYWORD...>   Search by keyword(s)
  -r, --regex <REGEX>          Search by regular expression
      --time-offset <OFFSET>   Scan recent events based on an offset (ex: 1y, 3M, 30d, 24h, 30m)
      --timeline-end <DATE>    End time of the event logs to load (ex: "2022-02-22 23:59:59 +09:00")
      --timeline-start <DATE>  Start time of the event logs to load (ex: "2020-02-22 00:00:00 +09:00")

Output:
  -b, --disable-abbreviations  Disable abbreviations
  -J, --JSON-output            Save the search results in JSON format (ex: -J -o results.json)
  -L, --JSONL-output           Save the search results in JSONL format (ex: -L -o results.jsonl)
  -M, --multiline              Output event field information in multiple rows for CSV output
  -o, --output <FILE>          Save the search results in CSV format (ex: search.csv)
  -S, --tab-separator          Separate event field information by tabs

Time Format:
      --European-time     Output timestamp in European time format (ex: 22-02-2022 22:00:00.123 +02:00)
  -O, --ISO-8601          Output timestamp in original ISO-8601 format (ex: 2022-02-22T10:10:10.1234567Z) (Always UTC)
      --RFC-2822          Output timestamp in RFC 2822 format (ex: Fri, 22 Feb 2022 22:00:00 -0600)
      --RFC-3339          Output timestamp in RFC 3339 format (ex: 2022-02-22 22:00:00.123456-06:00)
      --US-military-time  Output timestamp in US military time format (ex: 02-22-2022 22:00:00.123 -06:00)
      --US-time           Output timestamp in US time format (ex: 02-22-2022 10:00:00.123 PM -06:00)
  -U, --UTC               Output time in UTC format (default: local time)
Beispiele für den Befehl search
- Das Verzeichnis
../hayabusa-sample-evtxnach dem Schlüsselwortmimikatzdurchsuchen:
Hinweis: Das Schlüsselwort wird gefunden, wenn
mimikatzirgendwo in den Daten vorkommt. Es handelt sich nicht um eine exakte Übereinstimmung.
- Das Verzeichnis
../hayabusa-sample-evtxnach den Schlüsselwörternmimikatzoderkalidurchsuchen:
- Das Verzeichnis
../hayabusa-sample-evtxnach dem Schlüsselwortmimikatzdurchsuchen und Groß-/Kleinschreibung ignorieren:
- Das Verzeichnis
../hayabusa-sample-evtxmithilfe regulärer Ausdrücke nach IP-Adressen durchsuchen:
- Das Verzeichnis
../hayabusa-sample-evtxdurchsuchen und alle Ereignisse anzeigen, bei denen das FeldWorkstationNamegleichkaliist:
Hinweis:
.*ist der reguläre Ausdruck, der auf jedes Ereignis zutrifft.
Konfigurationsdateien für den Befehl search
./rules/config/channel_abbreviations.txt: Zuordnungen von Kanalnamen und ihren Abkürzungen.