Hayabusa Developer များအတွက် Rust Performance လမ်းညွှန်
စာရေးသူ
Fukusuke Takahashi
အင်္ဂလိပ်ဘာသာပြန်ဆိုမှု
Zach Mathis (@yamatosecurity)
ဤစာတမ်းအကြောင်း
Hayabusa (အင်္ဂလိပ်: "peregrine falcon") သည် ဂျပန်နိုင်ငံရှိ Yamato Security အဖွဲ့မှ တီထွင်ထားသော လျင်မြန်သည့် forensics ခွဲခြမ်းစိတ်ဖြာရေး tool တစ်ခုဖြစ်သည်။ peregrine falcon ကဲ့သို့ လျင်မြန်စွာ (ခြိမ်းခြောက်မှု) hunt ပြုလုပ်နိုင်ရန်အတွက် Rust ဖြင့် တီထွင်ထားခြင်းဖြစ်သည်။ Rust သည် သူ့ဘာသာသူ လျင်မြန်သော ဘာသာစကားတစ်ခုဖြစ်သော်လည်း နှေးကွေးမှုနှင့် memory အသုံးပြုမှု မြင့်မားလာစေသည့် ထောင်ချောက်များစွာ ရှိပါသည်။ ဤစာတမ်းကို Hayabusa တွင် တကယ်ဖြစ်ပျက်ခဲ့သော performance တိုးတက်မှုများအပေါ် အခြေခံ၍ ဖန်တီးထားသည် (changelog ကို ဤနေရာတွင် ကြည့်ပါ)၊ သို့သော် ဤနည်းပညာများကို အခြား Rust program များတွင်လည်း အသုံးပြုနိုင်သင့်ပါသည်။ ကျွန်ုပ်တို့၏ စမ်းသပ်မှုနှင့် အမှားပြုပြင်မှုများမှ ရရှိခဲ့သော အသိပညာများမှ သင် အကျိုးကျေးဇူး ရရှိနိုင်မည်ဟု မျှော်လင့်ပါသည်။
အမြန်နှုန်း တိုးတက်စေခြင်း
Memory allocator ကို ပြောင်းလဲခြင်း
default memory allocator ကို ရိုးရှင်းစွာ ပြောင်းလဲခြင်းဖြင့် အမြန်နှုန်း သိသိသာသာ တိုးတက်လာနိုင်ပါသည်။ ဥပမာအားဖြင့် ဤ benchmarks များအရ အောက်ပါ memory allocator နှစ်ခုဖြစ်သော
တို့သည် default memory allocator ထက် များစွာ ပိုမြန်ပါသည်။ ကျွန်ုပ်တို့သည် memory allocator ကို jemalloc မှ mimalloc သို့ ပြောင်းလဲခြင်းဖြင့် အမြန်နှုန်း သိသိသာသာ တိုးတက်မှုကို အတည်ပြုနိုင်ခဲ့သဖြင့် version 1.8.0 မှစ၍ mimalloc ကို default အဖြစ် ပြုလုပ်ခဲ့ပါသည်။ (mimalloc သည် jemalloc ထက် memory အနည်းငယ် ပိုသုံးသော်လည်းပါပဲ။)
မပြောင်းမီ 
ပြောင်းပြီးနောက် 
global memory allocator ကို ပြောင်းလဲရန် အောက်ပါ အဆင့် ၂ ဆင့်သာ ပြုလုပ်ရန် လိုအပ်ပါသည်:
- mimalloc crate ကို
Cargo.tomlဖိုင်၏ [dependencies] section တွင် ထည့်ပါ: - program အတွင်း တစ်နေရာရာတွင် #[global_allocator] အောက်တွင် mimalloc ကို အသုံးပြုလိုကြောင်း သတ်မှတ်ပါ: memory allocator ကို ပြောင်းလဲရန် ဤမျှသာ ပြုလုပ်ရန် လိုအပ်ပါသည်။
ထိရောက်မှု(Pull Request မှ တကယ့်ဥပမာ) 
အမြန်နှုန်း မည်မျှ တိုးတက်မည်ဆိုသည်မှာ program ပေါ်တွင် မူတည်သော်လည်း အောက်ပါ ဥပမာတွင်
memory allocator ကို mimalloc သို့ ပြောင်းလဲခြင်းသည် Intel CPU များတွင် performance 20-30% တိုးတက်မှု ဖြစ်ပေါ်စေခဲ့ပါသည်။ (အကြောင်းတစ်ခုခုကြောင့် ARM အခြေခံ macOS device များတွင်မူ performance တိုးတက်မှု သိသိသာသာ မရှိခဲ့ပါ။)
Loop များတွင် IO processing ကို လျှော့ချခြင်း
Disk IO processing သည် memory တွင် processing ပြုလုပ်ခြင်းထက် များစွာ နှေးပါသည်။ ထို့ကြောင့် အထူးသဖြင့် loop များတွင် IO processing ကို တတ်နိုင်သမျှ ရှောင်ရှားရန် သင့်လျော်ပါသည်။
မပြောင်းမီ 
အောက်ပါ ဥပမာတွင် loop အတွင်း file open ခြင်းကို တစ်သန်းကြိမ် ဖြစ်ပေါ်နေပုံကို ပြသထားသည်:
use std::fs;

fn main() {
    for _ in 0..1000000 {
        let f = fs::read_to_string("sample.txt").unwrap();
        f.len();
    }
}
ပြောင်းပြီးနောက် 
အောက်ပါအတိုင်း file ကို loop ၏ ပြင်ပတွင် open ခြင်းဖြင့်
use std::fs;

fn main() {
    let f = fs::read_to_string("sample.txt").unwrap();
    for _ in 0..1000000 {
        f.len();
    }
}
ထိရောက်မှု(Pull Request မှ တကယ့်ဥပမာ) 
အောက်ပါ ဥပမာတွင် detection result တစ်ခုစီကို ကိုင်တွယ်စဉ်က IO processing ကို loop ၏ ပြင်ပတွင် ပြုလုပ်နိုင်ခဲ့သည်:
ဤသည်က အမြန်နှုန်း 20% ခန့် တိုးတက်မှု ဖြစ်ပေါ်စေခဲ့သည်။
Loop များတွင် regular expression compilation ကို ရှောင်ရှားခြင်း
Regular expression compilation သည် regular expression matching နှင့် နှိုင်းယှဉ်ပါက အလွန် ကုန်ကျစရိတ်များသော လုပ်ငန်းစဉ်တစ်ခု ဖြစ်ပါသည်။ ထို့ကြောင့် အထူးသဖြင့် loop များတွင် regular expression compilation ကို တတ်နိုင်သမျှ ရှောင်ရှားရန် အကြံပြုပါသည်။
မပြောင်းမီ 
ဥပမာအားဖြင့် အောက်ပါ လုပ်ငန်းစဉ်သည် loop အတွင်း regular expression matching ၁၀၀,၀၀၀ ကြိမ် ဖန်တီးပါသည်:
extern crate regex;
use regex::Regex;

fn main() {
    let text = "1234567890";
    let match_str = "abc";
    for _ in 0..100000 {
        if Regex::new(match_str).unwrap().is_match(text){ // Regular expression compilation in a loop
            println!("matched!");
        }
    }
}
ပြောင်းပြီးနောက် 
အောက်တွင် ပြထားသည့်အတိုင်း regular expression compilation ကို loop ၏ ပြင်ပတွင် ပြုလုပ်ခြင်းဖြင့်
extern crate regex;
use regex::Regex;

fn main() {
    let text = "1234567890";
    let match_str = "abc";
    let r = Regex::new(match_str).unwrap(); // Compile the regular expression outside the loop
    for _ in 0..100000 {
        if r.is_match(text) {
            println!("matched!");
        }
    }
}
ထိရောက်မှု(Pull Request မှ တကယ့်ဥပမာ) 
အောက်ပါ ဥပမာတွင် regular expression compilation ကို loop ၏ ပြင်ပတွင် ပြုလုပ်ပြီး cache လုပ်ထားပါသည်။
ဤသည်က အမြန်နှုန်း သိသိသာသာ တိုးတက်မှု ဖြစ်ပေါ်စေခဲ့သည်။
Buffer IO ကို အသုံးပြုခြင်း
Buffer IO မပါဘဲ file IO သည် နှေးပါသည်။ buffer IO ဖြင့်ဆိုလျှင် IO operation များကို memory အတွင်းရှိ buffer များမှတစ်ဆင့် ပြုလုပ်သဖြင့် system call အရေအတွက် လျော့နည်းကာ အမြန်နှုန်း တိုးတက်လာပါသည်။
မပြောင်းမီ 
ဥပမာအားဖြင့် အောက်ပါ လုပ်ငန်းစဉ်တွင် write သည် ၁,၀၀၀,၀၀၀ ကြိမ် ဖြစ်ပေါ်ပါသည်။
use std::fs::File;
use std::io::{BufWriter, Write};

fn main() {
    let mut f = File::create("sample.txt").unwrap();
    for _ in 0..1000000 {
        f.write(b"hello world!");
    }
}
ပြောင်းပြီးနောက် 
အောက်ပါအတိုင်း BufWriter ကို အသုံးပြုခြင်းဖြင့်
use std::fs::File;
use std::io::{BufWriter, Write};

fn main() {
    let mut f = File::create("sample.txt").unwrap();
    let mut writer = BufWriter::new(f);
    for _ in 0..1000000 {
        writer.write(b"some text");
    }
    writer.flush().unwrap();
}
ထိရောက်မှု(Pull Request မှ တကယ့်ဥပမာ) 
အထက်တွင် ဖော်ပြထားသော method ကို ဤနေရာတွင် အကောင်အထည်ဖော်ခဲ့ပြီး
output processing တွင် အမြန်နှုန်း သိသိသာသာ တိုးတက်မှု ဖြစ်ပေါ်စေခဲ့သည်။
Regular expression များအစား standard String method များကို အသုံးပြုခြင်း
Regular expression များသည် ရှုပ်ထွေးသော matching pattern များကို လွှမ်းခြုံနိုင်သော်လည်း standard String method များထက် နှေးပါသည်။ ထို့ကြောင့် အောက်ပါကဲ့သို့ ရိုးရှင်းသော string matching များအတွက် standard String method များ အသုံးပြုခြင်းသည် ပိုမြန်ပါသည်။
- Starts-with matching(Regex:
foo.*)-> String::starts_with() - Ends-with matching(Regex:
.*foo)-> String::ends_with() - Contains matching(Regex:
.*foo.*)-> String::contains()
မပြောင်းမီ 
ဥပမာအားဖြင့် အောက်ပါ code သည် regular expression ဖြင့် ends-with matching ကို တစ်သန်းကြိမ် ပြုလုပ်ပါသည်။
extern crate regex;
use regex::Regex;

fn main() {
    let text = "1234567890";
    let match_str = ".*abc";
    let r = Regex::new(match_str).unwrap();
    for _ in 0..1000000 {
        if r.is_match(text) {
            println!("matched!");
        }
    }
}
ပြောင်းပြီးနောက် 
အောက်ပါအတိုင်း String::ends_with() ကို အသုံးပြုခြင်းဖြင့်
fn main() {
    let text = "1234567890";
    let match_str = "abc";
    for _ in 0..1000000 {
        if text.ends_with(match_str) {
            println!("matched!");
        }
    }
}
ထိရောက်မှု(Pull Request မှ တကယ့်ဥပမာ) 
Hayabusa သည် case-insensitive string နှိုင်းယှဉ်မှု လိုအပ်သဖြင့် to_lowercase() ကို အသုံးပြုပြီးနောက် အထက်ပါ method ကို သက်ရောက်စေပါသည်။ ထိုသို့ ပြုလုပ်သော်လည်း အောက်ပါ ဥပမာများတွင်
- Imporving speed by changing wildcard search process from regular expression match to starts_with/ends_with match #890
- Improving speed by using eq_ignore_ascii_case() before regular expression match #884
ယခင်နှင့် နှိုင်းယှဉ်ပါက အမြန်နှုန်း 15% ခန့် တိုးတက်ခဲ့သည်။
String အရှည်ဖြင့် filter လုပ်ခြင်း
ကိုင်တွယ်နေသော string များ၏ လက္ခဏာများပေါ်တွင် မူတည်၍ ရိုးရှင်းသော filter တစ်ခု ထည့်သွင်းခြင်းဖြင့် string matching ကြိုးပမ်းမှု အရေအတွက်ကို လျှော့ချနိုင်ပြီး လုပ်ငန်းစဉ်ကို မြန်ဆန်စေနိုင်ပါသည်။ string အရှည် ပုံသေမဟုတ်ဘဲ မကိုက်ညီသော string များကို မကြာခဏ နှိုင်းယှဉ်ပါက string အရှည်ကို အဓိက filter အဖြစ် အသုံးပြုခြင်းဖြင့် လုပ်ငန်းစဉ်ကို မြန်ဆန်စေနိုင်ပါသည်။
မပြောင်းမီ 
ဥပမာအားဖြင့် အောက်ပါ code သည် regular expression matching ကို တစ်သန်းကြိမ် ကြိုးပမ်းပါသည်။
extern crate regex;
use regex::Regex;

fn main() {
    let text = "1234567890";
    let match_str = "abc";
    let r = Regex::new(match_str).unwrap();
    for _ in 0..1000000 {
        if r.is_match(text) {
            println!("matched!");
        }
    }
}
ပြောင်းပြီးနောက် 
အောက်တွင် ပြထားသည့်အတိုင်း String::len() ကို အဓိက filter အဖြစ် အသုံးပြုခြင်းဖြင့်
extern crate regex;
use regex::Regex;

fn main() {
    let text = "1234567890";
    let match_str = "abc";
    let r = Regex::new(match_str).unwrap();
    for _ in 0..1000000 {
        if text.len() == match_str.len() { // Primary filter by string length
            if r.is_match(text) {
                println!("matched!");
            }
        }
    }
}
ထိရောက်မှု(Pull Request မှ တကယ့်ဥပမာ) 
အောက်ပါ ဥပမာတွင် အထက်ပါ method ကို အသုံးပြုထားသည်။
ဤသည်က အမြန်နှုန်း 15% ခန့် တိုးတက်စေခဲ့သည်။
codegen-units=1 ဖြင့် compile မလုပ်ပါနှင့်
Rust ဖြင့် performance optimization နှင့်ပတ်သက်သော ဆောင်းပါးများစွာတွင် [profile.release] section အောက်တွင် codegen-units = 1 ကို ထည့်ရန် အကြံပြုထားကြသည်။
ဤသည်က default အနေဖြင့် parallel ဖြင့် compile လုပ်နေသဖြင့် compile အချိန်ကို နှေးကွေးစေမည်ဖြစ်သော်လည်း သီအိုရီအရ ပိုမို optimize ဖြစ်ပြီး ပိုမြန်သော code ဖြစ်ပေါ်စေသင့်သည်။
သို့သော် ကျွန်ုပ်တို့၏ စမ်းသပ်မှုတွင် Hayabusa သည် ဤ option ကို ဖွင့်ထားသည့်အခါ တကယ်တမ်း ပိုနှေးကာ compile လုပ်ချိန်လည်း ပိုကြာသဖြင့် ၎င်းကို ပိတ်ထားပါသည်။
executable ၏ binary size သည် ၁၀၀kb ခန့် ပိုသေးငယ်သဖြင့် hard disk space အကန့်အသတ်ရှိသော embedded system များအတွက် ဤသည်က သင့်လျော်ပေမည်။
Memory အသုံးပြုမှု လျှော့ချခြင်း
clone(), to_string(), နှင့် to_owned() တို့ကို မလိုအပ်ဘဲ အသုံးပြုခြင်းကို ရှောင်ရှားခြင်း
clone() သို့မဟုတ် to_string() ကို အသုံးပြုခြင်းသည် ownership နှင့် ဆက်စပ်သော compilation error များကို ဖြေရှင်းရန် လွယ်ကူသော နည်းလမ်းများ ဖြစ်ပါသည်။ သို့သော် ၎င်းတို့သည် များသောအားဖြင့် memory ကို မြင့်မားစွာ အသုံးပြုစေသဖြင့် ရှောင်ရှားသင့်ပါသည်။ ၎င်းတို့ကို ကုန်ကျစရိတ်နည်းသော reference များဖြင့် အစားထိုးနိုင်မလားဆိုသည်ကို အရင်ဆုံး ကြည့်ရှုခြင်းသည် အမြဲ အကောင်းဆုံး ဖြစ်ပါသည်။
မပြောင်းမီ 
ဥပမာအားဖြင့် တူညီသော Vec ကို အကြိမ်များစွာ iterate လုပ်လိုပါက clone() ကို အသုံးပြု၍ compilation error များကို ဖယ်ရှားနိုင်သည်။
fn main() {
    let lst = vec![1, 2, 3];
    for x in lst.clone() { // In order to eliminate compile errors
        println!("{x}");
    }

    for x in lst {
        println!("{x}");
    }
}
ပြောင်းပြီးနောက် 
သို့သော် အောက်တွင် ပြထားသည့်အတိုင်း reference များကို အသုံးပြုခြင်းဖြင့် clone() အသုံးပြုရန် လိုအပ်မှုကို ဖယ်ရှားနိုင်ပါသည်။
fn main() {
    let lst = vec![1, 2, 3];
    for x in &lst { // Eliminate compile errors with a reference
        println!("{x}");
    }

    for x in lst {
        println!("{x}");
    }
}
ထိရောက်မှု(Pull Request မှ တကယ့်ဥပမာ) 
အောက်ပါ ဥပမာတွင် မလိုအပ်သော clone(), to_string(), နှင့် to_owned() အသုံးပြုမှုများကို အစားထိုးခြင်းဖြင့်
memory အသုံးပြုမှုကို သိသိသာသာ လျှော့ချနိုင်ခဲ့ပါသည်။
Vec အစား Iterator ကို အသုံးပြုခြင်း
Vec သည် element အားလုံးကို memory တွင် သိမ်းဆည်းထားသဖြင့် element အရေအတွက်နှင့် အချိုးကျ memory များစွာ အသုံးပြုပါသည်။ element တစ်ခုစီ ကိုင်တွယ်ခြင်းဖြင့် လုံလောက်ပါက ၎င်းအစား Iterator ကို အသုံးပြုခြင်းသည် memory များစွာ ပိုနည်းနည်း အသုံးပြုပါမည်။
မပြောင်းမီ 
ဥပမာအားဖြင့် အောက်ပါ return_lines() function သည် ၁ GB ခန့်ရှိသော file ကို ဖတ်ပြီး Vec ကို ပြန်ပေးပါသည်:
use std::fs::File;
use std::io::{BufRead, BufReader};

fn return_lines() -> Vec<String> {
    let f = File::open("sample.txt").unwrap();
    let buf = BufReader::new(f);
    buf.lines()
        .map(|l| l.expect("Could not parse line"))
        .collect()
}

fn main() {
    let lines = return_lines();
    for line in lines {
        println!("{}", line)
    }
}
ပြောင်းပြီးနောက် 
ထိုအစား အောက်ပါအတိုင်း Iterator Trait ကို ပြန်ပေးသင့်ပါသည်:
use std::fs::File;
use std::io::{BufRead, BufReader};

fn return_lines() -> impl Iterator<Item=String> {
    let f = File::open("sample.txt").unwrap();
    let buf = BufReader::new(f);
    buf.lines()
        .map(|l| l.expect("Could not parse line"))
        // ここでcollect()せずに、Iteratorを戻り値として返す
}

fn main() {
    let lines = return_lines();
    for line in lines {
        println!("{}", line)
    }
}
Box<dyn Iterator<Item = T>> ကို ပြန်ပေးနိုင်ပါသည်:
use std::fs::File;
use std::io::{BufRead, BufReader};

fn return_lines(need_filter:bool) -> Box<dyn Iterator<Item = String>> {
    let f = File::open("sample.txt").unwrap();
    let buf = BufReader::new(f);
    if need_filter {
        let result= buf.lines()
            .filter_map(|l| l.ok())
            .map(|l| l.replace("A", "B"));
        return Box::new(result)
    }
    let result= buf.lines()
        .map(|l| l.expect("Could not parse line"));
    Box::new(result)
}

fn main() {
    let lines = return_lines(true);
    for line in lines {
        println!("{}", line)
    }
}
ထိရောက်မှု(Pull Request မှ တကယ့်ဥပမာ) 
အောက်ပါ ဥပမာတွင် အထက်ဖော်ပြပါ method ကို အသုံးပြုထားသည်:
1.7GB JSON file တွင် စမ်းသပ်သောအခါ memory 75% လျော့ကျသွားခဲ့သည်။
String တိုများ ကိုင်တွယ်သည့်အခါ compact_str crate ကို အသုံးပြုခြင်း
24 byte အောက် string တိုများ အများအပြားကို ကိုင်တွယ်သည့်အခါ compact_str crate ကို အသုံးပြု၍ memory အသုံးပြုမှု လျှော့ချနိုင်ပါသည်။
မပြောင်းမီ 
အောက်ပါ ဥပမာတွင် Vec သည် string ၁၀ သန်း သိမ်းဆည်းထားသည်။
fn main() {
    let v: Vec<String> = vec![String::from("ABCDEFGHIJKLMNOPQRSTUV"); 10000000];
    // do some kind of processing
}
ပြောင်းပြီးနောက် 
၎င်းတို့ကို CompactString ဖြင့် အစားထိုးခြင်းသည် ပိုကောင်းပါသည်:
use compact_str::CompactString;

fn main() {
    let v: Vec<CompactString> = vec![CompactString::from("ABCDEFGHIJKLMNOPQRSTUV"); 10000000];
    // do some kind of processing
}
ထိရောက်မှု(Pull Request မှ တကယ့်ဥပမာ) 
အောက်ပါ ဥပမာတွင် string တိုများကို CompactString ဖြင့် ကိုင်တွယ်ထားသည်:
ဤသည်က memory အသုံးပြုမှု 20% ခန့် လျှော့ချမှု ပေးခဲ့သည်။
Long-lived structure များတွင် မလိုအပ်သော field များကို ဖျက်ခြင်း
process startup အတွင်း memory တွင် ဆက်လက် သိမ်းဆည်းထားသော structure များသည် overall memory အသုံးပြုမှုကို သက်ရောက်စေနိုင်ပါသည်။ Hayabusa တွင် အောက်ပါ structure များ (version 2.2.2 အရ) ကို အထူးသဖြင့် အရေအတွက်များစွာ သိမ်းဆည်းထားပါသည်။
အထက်ပါ structure များနှင့် ဆက်စပ်သော field များကို ဖယ်ရှားခြင်းသည် overall memory အသုံးပြုမှု လျှော့ချရာတွင် အကျိုးသက်ရောက်မှု အနည်းငယ် ရှိခဲ့ပါသည်။
မပြောင်းမီ 
ဥပမာအားဖြင့် DetectInfo field သည် version 1.8.1 အထိ အောက်ပါအတိုင်း ဖြစ်ခဲ့သည်:
#[derive(Debug, Clone)]
pub struct DetectInfo {
    pub rulepath: CompactString,
    pub ruletitle: CompactString,
    pub level: CompactString,
    pub computername: CompactString,
    pub eventid: CompactString,
    pub detail: CompactString,
    pub record_information: CompactString,
    pub ext_field: Vec<(CompactString, Profile)>,
    pub is_condition: bool,
}
ပြောင်းပြီးနောက် 
အောက်ပါအတိုင်း record_information field ကို ဖျက်ခြင်းဖြင့်
#[derive(Debug, Clone)]
pub struct DetectInfo {
    pub rulepath: CompactString,
    pub ruletitle: CompactString,
    pub level: CompactString,
    pub computername: CompactString,
    pub eventid: CompactString,
    pub detail: CompactString,
    // remove record_information field
    pub ext_field: Vec<(CompactString, Profile)>,
    pub is_condition: bool,
}
ထိရောက်မှု(Pull Request မှ တကယ့်ဥပမာ) 
အောက်ပါ ဥပမာတွင် detection result record အရေအတွက် ၁.၅ သန်းခန့်ရှိသော data ကို စမ်းသပ်သောအခါ
- Reduced memory usage of DetectInfo/EvtxRecordInfo #837
- Reduce memory usage by removing unnecessary regex #894
memory အသုံးပြုမှု 300MB ခန့် လျှော့ချနိုင်ခဲ့ပါသည်။
Benchmarking
Memory allocator ၏ statistics function ကို အသုံးပြုခြင်း
memory allocator အချို့သည် ၎င်းတို့၏ ကိုယ်ပိုင် memory အသုံးပြုမှု statistics ကို ထိန်းသိမ်းထားပါသည်။ ဥပမာအားဖြင့် mimalloc တွင် mi_stats_print_out() function ကို ခေါ်၍ memory အသုံးပြုမှုကို ရယူနိုင်ပါသည်။
statistics ရယူနည်း 
လိုအပ်ချက်များ: Memory allocator ကို ပြောင်းလဲခြင်း အပိုင်းတွင် ရှင်းပြထားသည့်အတိုင်း mimalloc ကို အသုံးပြုနေရန် လိုအပ်ပါသည်။
Cargo.toml၏ dependencies section တွင် libmimalloc-sys crate ကို ထည့်ပါ:- memory အသုံးပြုမှု statistics ကို print ထုတ်လိုသည့်အခါတိုင်း အောက်ပါ code ကို ရေးပြီး
unsafeblock အတွင်း mi_stats_print_out() ကို ခေါ်ပါ။ memory အသုံးပြုမှု statistics ကို standard out သို့ ထုတ်ပေးပါမည်။ -
ဘယ်ဘက်အပေါ်ထောင့်ရှိ
peak/reservedvalue သည် အမြင့်ဆုံး memory အသုံးပြုမှု ဖြစ်ပါသည်။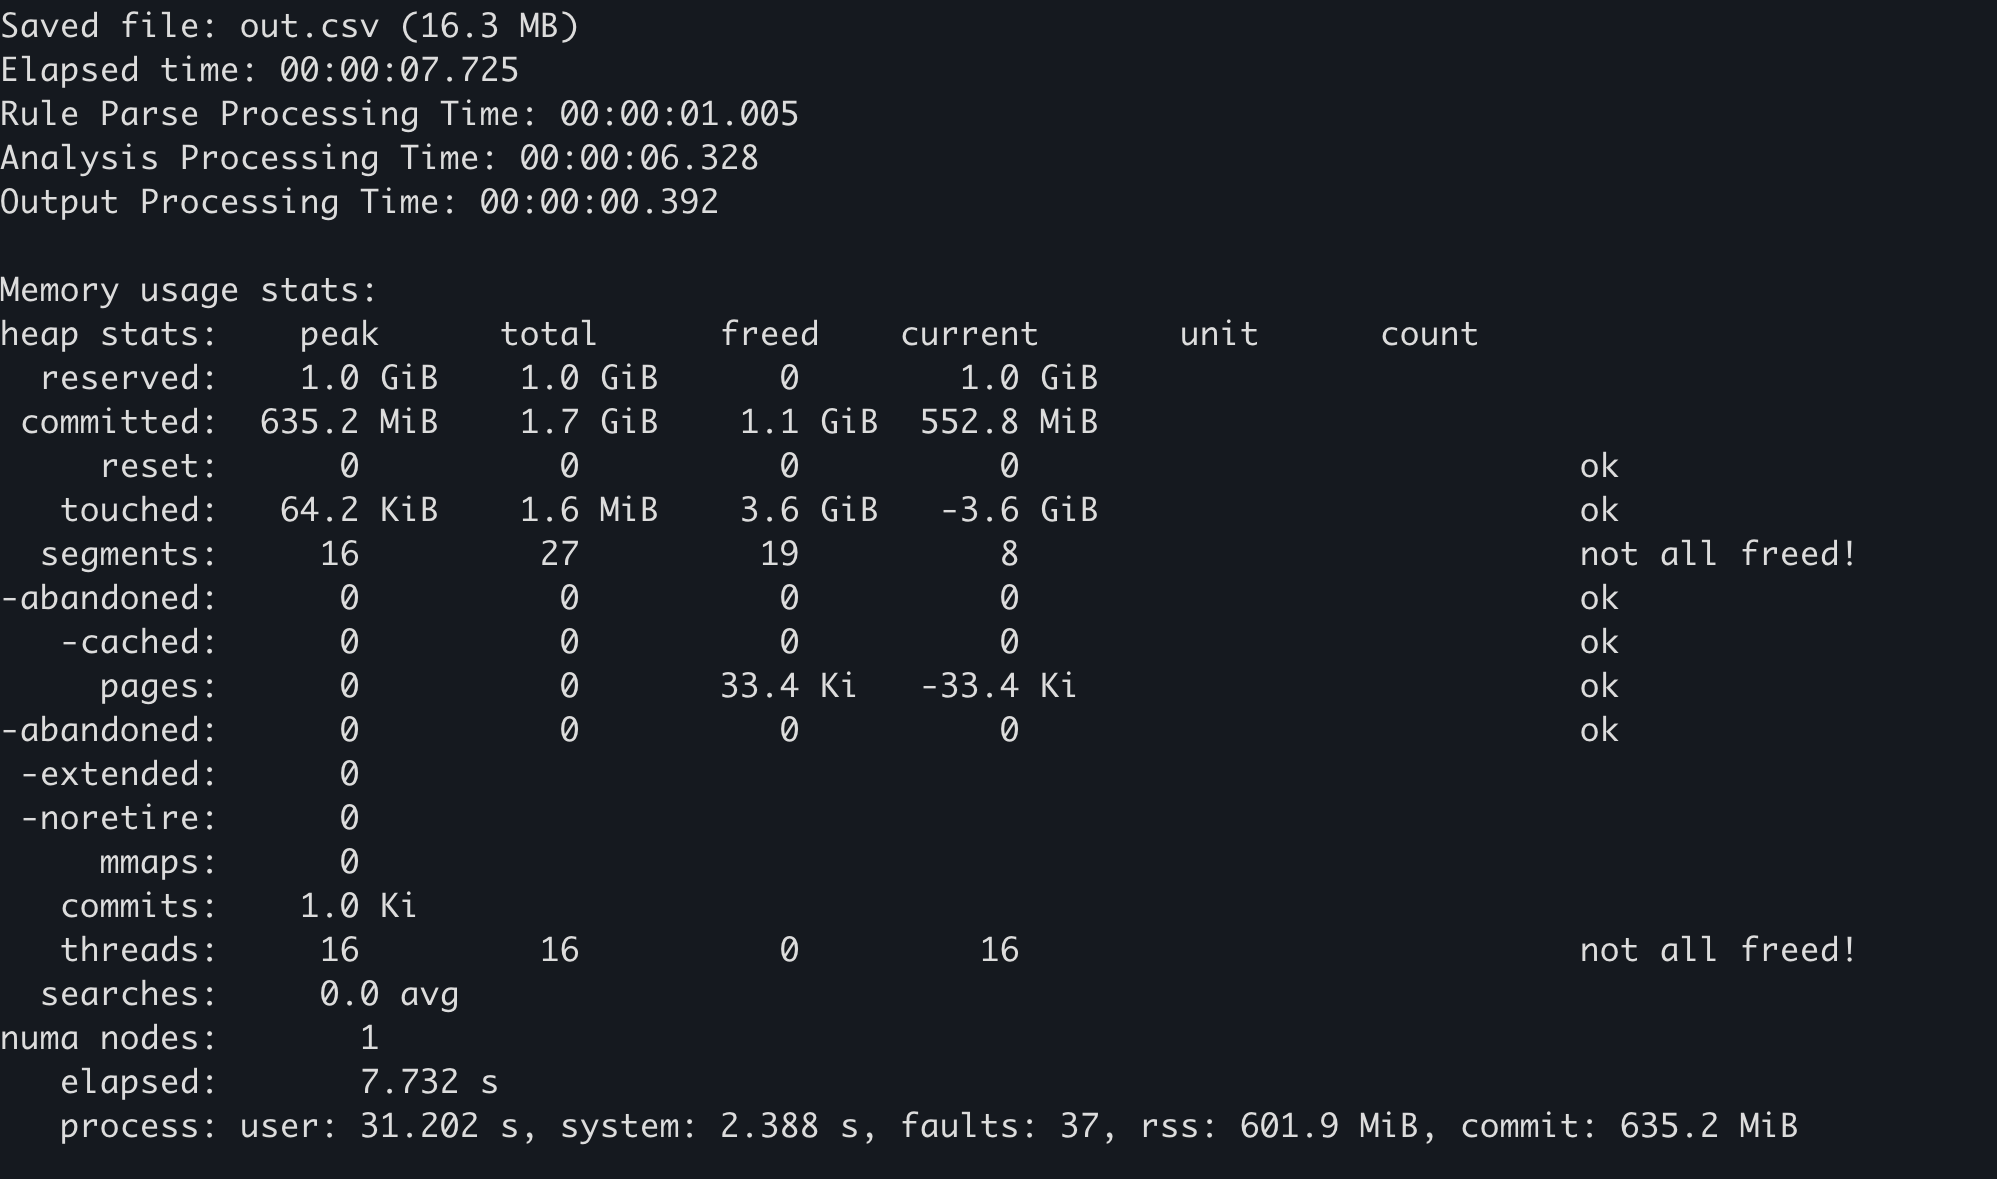
ဥပမာ 
အထက်ပါ အကောင်အထည်ဖော်မှုကို အောက်ပါတွင် သက်ရောက်စေခဲ့သည်:
Hayabusa တွင် --debug option ကို ထည့်ပါက memory အသုံးပြုမှု statistics ကို အဆုံးတွင် ထုတ်ပေးပါမည်။
Windows ၏ performance counter ကို အသုံးပြုခြင်း
OS ဘက်တွင် ရယူနိုင်သော statistics မှ resource အသုံးပြုမှု အမျိုးမျိုးကို စစ်ဆေးနိုင်ပါသည်။ ဤကိစ္စတွင် အောက်ပါ အချက်နှစ်ချက်ကို သတိပြုသင့်ပါသည်။
- anti-virus software (Windows Defender) မှ သက်ရောက်မှု
- ပထမအကြိမ် run ခြင်းသာ scan ၏ သက်ရောက်မှုခံရပြီး ပိုနှေးသဖြင့် build ပြီးနောက် ဒုတိယအကြိမ်နှင့် နောက်ဆက်တွဲ အကြိမ်များ၏ ရလဒ်များသည် နှိုင်းယှဉ်ရန် သင့်လျော်ပါသည်။ (သို့မဟုတ် ပိုတိကျသော ရလဒ်များအတွက် သင့် anti-virus ကို disable လုပ်နိုင်ပါသည်။)
- file caching မှ သက်ရောက်မှု
- OS startup ပြီးနောက် ဒုတိယအကြိမ်နှင့် နောက်ဆက်တွဲ အကြိမ်များ၏ ရလဒ်များသည် evtx နှင့် အခြား file IO များကို memory အတွင်းရှိ file cache မှ ဖတ်သဖြင့် ပထမအကြိမ်ထက် ပိုမြန်ပါသည်၊ ထို့ကြောင့် OS boot ပြီးနောက် ပထမအကြိမ်၏ ရလဒ်များသည် benchmark ယူရန် ပိုသင့်လျော်ပါသည်။
ရယူနည်း 
လိုအပ်ချက်များ:အောက်ပါ လုပ်ထုံးလုပ်နည်းသည် Windows တွင် PowerShell 7 ကို တပ်ဆင်ပြီးသား environment များတွင်သာ မှန်ကန်ပါသည်။
- OS ကို restart လုပ်ပါ
- performance counter ကို တစ်စက္ကန့်လျှင်တစ်ကြိမ် CSV file သို့ ဆက်တိုက် မှတ်တမ်းတင်မည့်
PowerShell 7၏ Get-Counter command ကို run ပါ။ (အောက်ဖော်ပြပါမှ မဟုတ်သော အခြား resource များကို တိုင်းတာလိုပါက ဤဆောင်းပါး သည် ကောင်းသော အကိုးအကား ဖြစ်ပါသည်။) - တိုင်းတာလိုသော process ကို execute လုပ်ပါ။
ဥပမာ 
အောက်ပါတွင် Hayabusa ဖြင့် performance တိုင်းတာရန် ဥပမာ လုပ်ထုံးလုပ်နည်း ပါဝင်ပါသည်။
heaptrack ကို အသုံးပြုခြင်း
heaptrack သည် Linux နှင့် macOS အတွက် ရရှိနိုင်သော ခေတ်မီသော memory profiler တစ်ခုဖြစ်သည်။ heaptrack ကို အသုံးပြုခြင်းဖြင့် bottleneck များကို သေချာစွာ စုံစမ်းနိုင်ပါသည်။
ရယူနည်း 
လိုအပ်ချက်များ: အောက်တွင် Ubuntu 22.04 အတွက် လုပ်ထုံးလုပ်နည်း ဖြစ်သည်။ heaptrack ကို Windows တွင် အသုံးမပြုနိုင်ပါ။
- heaptrack ကို အောက်ပါ command နှစ်ခုဖြင့် install လုပ်ပါ။
- Hayabusa မှ အောက်ပါ mimalloc code ကို ဖယ်ရှားပါ။ (heaptrack ၏ memory profiler ကို mimalloc ဖြင့် အသုံးမပြုနိုင်ပါ။
- https://github.com/Yamato-Security/hayabusa/blob/v2.2.2/src/main.rs#L32-L33
- https://github.com/Yamato-Security/hayabusa/blob/v2.2.2/src/main.rs#L59-L60
-
https://github.com/Yamato-Security/hayabusa/blob/v2.2.2/src/main.rs#L632-L634
-
Hayabusa ၏
Cargo.tomlfile ရှိ [profile.release] section ကို ဖျက်ပြီး အောက်ပါအတိုင်း ပြောင်းပါ: -
release build တစ်ခု build လုပ်ပါ:
cargo build --release heaptrack hayabusa csv-timeline -d sample -o out.csvကို run ပါ
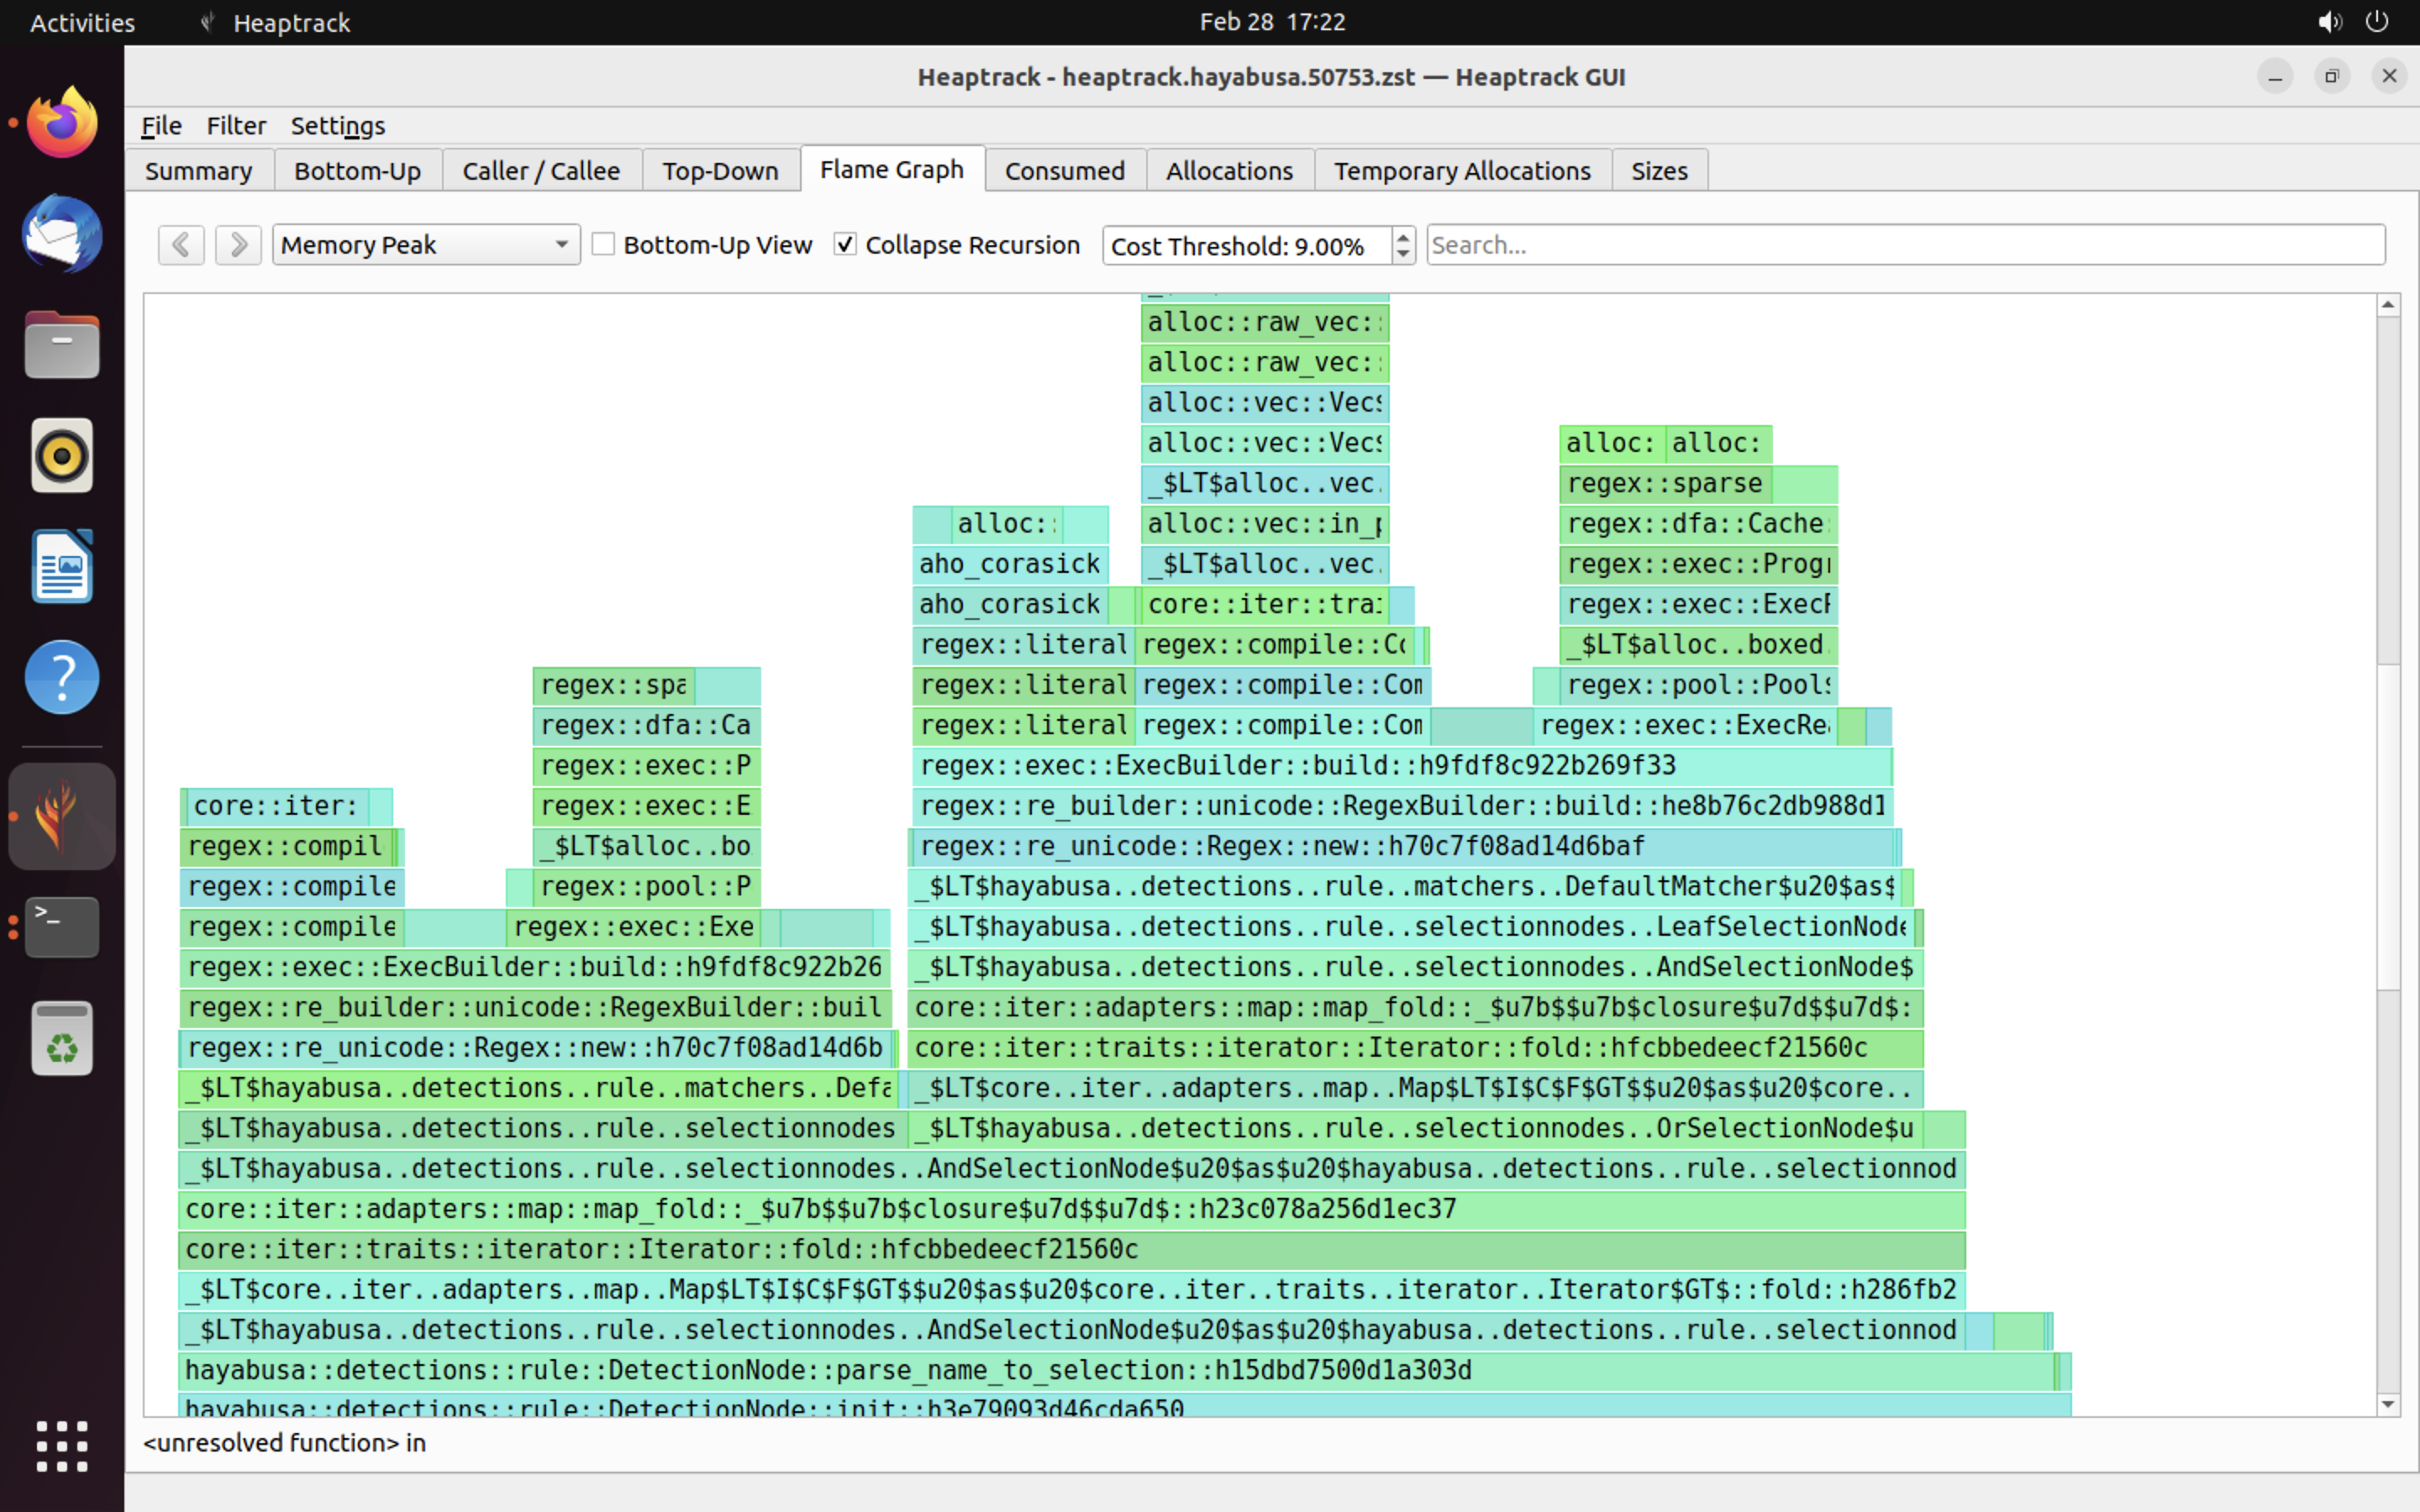
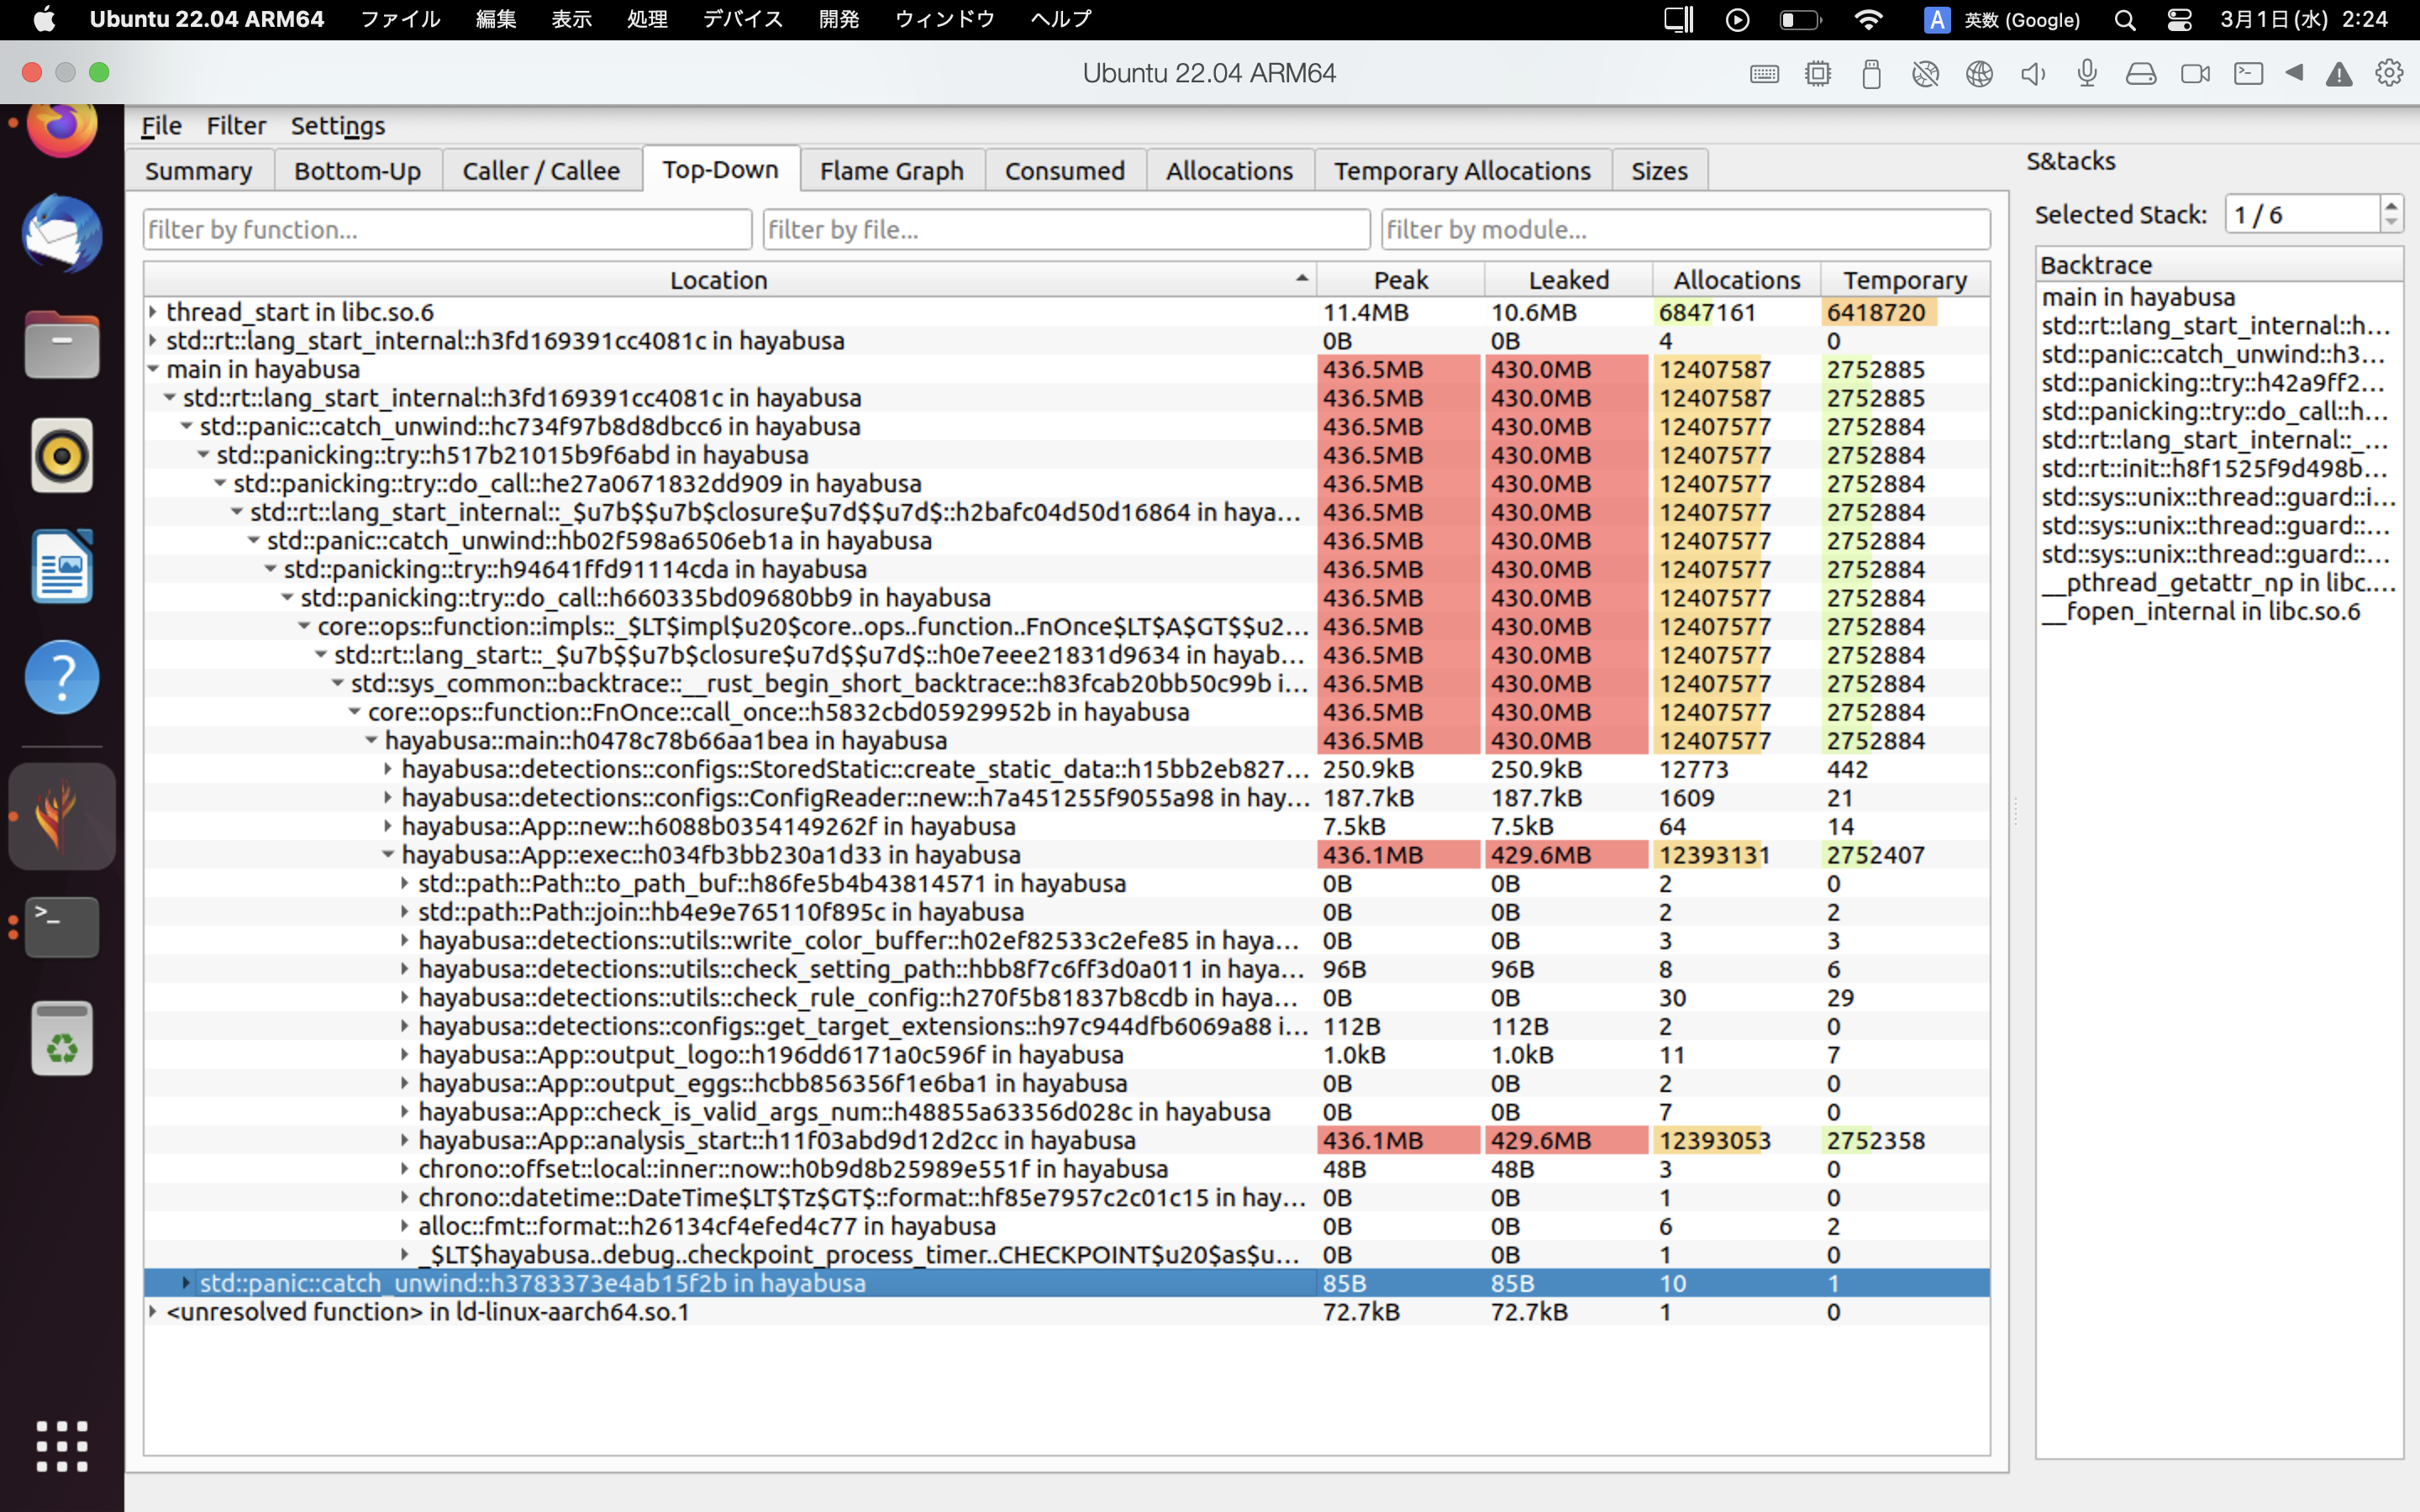
ယခု Hayabusa run ပြီးသွားသောအခါ heaptrack ၏ ရလဒ်များသည် GUI application တစ်ခုတွင် အလိုအလျောက် ပွင့်လာပါမည်။
ဥပမာများ 
heaptrack ၏ ရလဒ်များ ဥပမာကို အောက်တွင် ပြထားသည်။ Flame Graph နှင့် Top-Down tab များသည် memory အသုံးပြုမှု မြင့်မားသော function များကို မြင်သာစွာ စစ်ဆေးနိုင်စေပါသည်။
အကိုးအကားများ
ပံ့ပိုးကူညီမှုများ
ဤစာတမ်းသည် Hayabusa တွင် တကယ့် တိုးတက်မှု ဖြစ်ရပ်များမှ ရရှိသော တွေ့ရှိချက်များအပေါ် အခြေခံထားသည်။ အမှားများ သို့မဟုတ် performance တိုးတက်စေနိုင်သော နည်းပညာများ တွေ့ရှိပါက ကျွန်ုပ်တို့ထံ issue သို့မဟုတ် pull request တစ်ခု ပေးပို့ပါ။