給 Hayabusa 開發者的 Rust 效能指南
作者
Fukusuke Takahashi
英文翻譯
Zach Mathis (@yamatosecurity)
關於本文件
Hayabusa(英文:「peregrine falcon」,即遊隼)是由日本 Yamato Security 團隊所開發的快速鑑識分析工具。它以 Rust 開發,目的是要像遊隼一樣快速地進行(威脅)獵捕。Rust 本身就是一種快速的語言,然而其中有許多陷阱可能導致速度緩慢與記憶體用量過高。我們根據 Hayabusa 實際的效能改善(請參閱此處的變更記錄)撰寫了本文件,但這些技巧應該也適用於其他 Rust 程式。我們希望您能從我們透過反覆試驗所獲得的知識中受益。
速度改善
變更記憶體配置器
單純變更預設的記憶體配置器,就可能大幅改善速度。 舉例來說,根據這些基準測試,下列這兩種記憶體配置器
比預設的記憶體配置器快上許多。我們將記憶體配置器從 jemalloc 改為 mimalloc 後,能夠確認速度有顯著改善,因此自 1.8.0 版起將 mimalloc 設為預設值。(雖然 mimalloc 確實會比 jemalloc 多使用一些記憶體。)
Before 
After 
您只需要執行下列 2 個步驟,即可變更全域記憶體配置器:
- 將 mimalloc crate 加入
Cargo.toml檔案的 [dependencies] 區段: - 在程式的某處於 #[global_allocator] 下宣告您想要使用 mimalloc: 這就是變更記憶體配置器所需要做的全部。
成效(取自 Pull Request 的實際範例) 
速度能改善多少取決於程式本身,但在下列範例中
將記憶體配置器改為 mimalloc 後,在 Intel CPU 上帶來了 20-30% 的效能提升。 (不知為何,在以 ARM 為基礎的 macOS 裝置上並沒有那麼顯著的效能提升。)
減少迴圈中的 IO 處理
磁碟 IO 處理比在記憶體中的處理慢上許多。因此,最好盡可能避免 IO 處理,尤其是在迴圈中。
Before 
下面的範例顯示在迴圈中開啟檔案一百萬次:
use std::fs;

fn main() {
    for _ in 0..1000000 {
        let f = fs::read_to_string("sample.txt").unwrap();
        f.len();
    }
}
After 
如下所示,在迴圈外開啟檔案
use std::fs;

fn main() {
    let f = fs::read_to_string("sample.txt").unwrap();
    for _ in 0..1000000 {
        f.len();
    }
}
成效(取自 Pull Request 的實際範例) 
在下列範例中,原本一次處理一筆偵測結果時的 IO 處理得以移到迴圈外執行:
這帶來了約 20% 的速度改善。
避免在迴圈中編譯正規表示式
與正規表示式比對相比,正規表示式的編譯是非常耗費成本的處理。因此,建議盡可能避免編譯正規表示式,尤其是在迴圈中。
Before 
舉例來說,下列處理在迴圈中建立了 100,000 次正規表示式比對的嘗試:
extern crate regex;
use regex::Regex;

fn main() {
    let text = "1234567890";
    let match_str = "abc";
    for _ in 0..100000 {
        if Regex::new(match_str).unwrap().is_match(text){ // Regular expression compilation in a loop
            println!("matched!");
        }
    }
}
After 
如下所示,在迴圈外進行正規表示式的編譯
extern crate regex;
use regex::Regex;

fn main() {
    let text = "1234567890";
    let match_str = "abc";
    let r = Regex::new(match_str).unwrap(); // Compile the regular expression outside the loop
    for _ in 0..100000 {
        if r.is_match(text) {
            println!("matched!");
        }
    }
}
成效(取自 Pull Request 的實際範例) 
在下列範例中,正規表示式在迴圈外編譯並加以快取。
這帶來了顯著的速度改善。
使用緩衝 IO
若沒有緩衝 IO,檔案 IO 會很慢。有了緩衝 IO,IO 作業會透過記憶體中的緩衝區執行,減少系統呼叫的次數並改善速度。
Before 
舉例來說,在下列處理中,write 會發生 1,000,000 次。
use std::fs::File;
use std::io::{BufWriter, Write};

fn main() {
    let mut f = File::create("sample.txt").unwrap();
    for _ in 0..1000000 {
        f.write(b"hello world!");
    }
}
After 
如下所示,藉由使用 BufWriter
use std::fs::File;
use std::io::{BufWriter, Write};

fn main() {
    let mut f = File::create("sample.txt").unwrap();
    let mut writer = BufWriter::new(f);
    for _ in 0..1000000 {
        writer.write(b"some text");
    }
    writer.flush().unwrap();
}
成效(取自 Pull Request 的實際範例) 
上述方法已在此實作
並在輸出處理上帶來了顯著的速度改善。
使用標準 String 方法取代正規表示式
雖然正規表示式能涵蓋複雜的比對模式,但它們比標準 String 方法慢。因此,對於下列這類簡單的字串比對,使用標準 String 方法會更快。
- 開頭比對(Regex:
foo.*)-> String::starts_with() - 結尾比對(Regex:
.*foo)-> String::ends_with() - 包含比對(Regex:
.*foo.*)-> String::contains()
Before 
舉例來說,下列程式碼以正規表示式進行結尾比對一百萬次。
extern crate regex;
use regex::Regex;

fn main() {
    let text = "1234567890";
    let match_str = ".*abc";
    let r = Regex::new(match_str).unwrap();
    for _ in 0..1000000 {
        if r.is_match(text) {
            println!("matched!");
        }
    }
}
After 
如下所示,藉由使用 String::ends_with()
fn main() {
    let text = "1234567890";
    let match_str = "abc";
    for _ in 0..1000000 {
        if text.ends_with(match_str) {
            println!("matched!");
        }
    }
}
成效(取自 Pull Request 的實際範例) 
由於 Hayabusa 需要不分大小寫的字串比較,我們會先使用 to_lowercase(),再套用上述方法。即便如此,在下列範例中
- Imporving speed by changing wildcard search process from regular expression match to starts_with/ends_with match #890
- Improving speed by using eq_ignore_ascii_case() before regular expression match #884
速度比之前改善了約 15%。
以字串長度過濾
依據所處理字串的特性,加入一個簡單的過濾條件,或許能減少字串比對的嘗試次數並加速處理。如果您經常比較長度不固定且不相符的字串,您可以利用字串長度作為初步過濾條件來加速處理。
Before 
舉例來說,下列程式碼嘗試一百萬次正規表示式比對。
extern crate regex;
use regex::Regex;

fn main() {
    let text = "1234567890";
    let match_str = "abc";
    let r = Regex::new(match_str).unwrap();
    for _ in 0..1000000 {
        if r.is_match(text) {
            println!("matched!");
        }
    }
}
After 
如下所示,藉由使用 String::len() 作為初步過濾條件
extern crate regex;
use regex::Regex;

fn main() {
    let text = "1234567890";
    let match_str = "abc";
    let r = Regex::new(match_str).unwrap();
    for _ in 0..1000000 {
        if text.len() == match_str.len() { // Primary filter by string length
            if r.is_match(text) {
                println!("matched!");
            }
        }
    }
}
成效(取自 Pull Request 的實際範例) 
在下列範例中使用了上述方法。
這改善了約 15% 的速度。
不要以 codegen-units=1 進行編譯
許多關於 Rust 效能最佳化的文章建議在 [profile.release] 區段下加入 codegen-units = 1。
這會使編譯時間變慢,因為預設是平行編譯,但理論上應能產生更最佳化且更快速的程式碼。
然而,在我們的測試中,Hayabusa 開啟此選項後實際上執行得更慢且編譯耗時更久,因此我們將其保持關閉。
執行檔的二進位大小約小 100kb,因此這對於硬碟空間有限的嵌入式系統可能較為理想。
減少記憶體用量
避免不必要地使用 clone()、to_string() 與 to_owned()
使用 clone() 或 to_string() 是解決與所有權相關之編譯錯誤的簡便方法。然而,它們通常會導致高記憶體用量,應予以避免。最好總是先看看是否能以成本低廉的參考來取代它們。
Before 
舉例來說,如果您想多次迭代同一個 Vec,您可以使用 clone() 來消除編譯錯誤。
fn main() {
    let lst = vec![1, 2, 3];
    for x in lst.clone() { // In order to eliminate compile errors
        println!("{x}");
    }

    for x in lst {
        println!("{x}");
    }
}
After 
然而,如下所示,藉由使用參考,您可以移除使用 clone() 的必要。
fn main() {
    let lst = vec![1, 2, 3];
    for x in &lst { // Eliminate compile errors with a reference
        println!("{x}");
    }

    for x in lst {
        println!("{x}");
    }
}
成效(取自 Pull Request 的實際範例) 
在下列範例中,藉由取代不必要的 clone()、to_string() 與 to_owned() 使用,
我們得以顯著減少記憶體用量。
使用 Iterator 取代 Vec
Vec 會將所有元素保存在記憶體中,因此它會依元素數量成比例地使用大量記憶體。如果一次處理一個元素就已足夠,那麼改用 Iterator 會使用少得多的記憶體。
Before 
舉例來說,下列 return_lines() 函式讀取一個約 1 GB 的檔案並回傳一個 Vec:
use std::fs::File;
use std::io::{BufRead, BufReader};

fn return_lines() -> Vec<String> {
    let f = File::open("sample.txt").unwrap();
    let buf = BufReader::new(f);
    buf.lines()
        .map(|l| l.expect("Could not parse line"))
        .collect()
}

fn main() {
    let lines = return_lines();
    for line in lines {
        println!("{}", line)
    }
}
After 
您應改為如下所示回傳一個 Iterator Trait:
use std::fs::File;
use std::io::{BufRead, BufReader};

fn return_lines() -> impl Iterator<Item=String> {
    let f = File::open("sample.txt").unwrap();
    let buf = BufReader::new(f);
    buf.lines()
        .map(|l| l.expect("Could not parse line"))
        // ここでcollect()せずに、Iteratorを戻り値として返す
}

fn main() {
    let lines = return_lines();
    for line in lines {
        println!("{}", line)
    }
}
Box<dyn Iterator<Item = T>>:
use std::fs::File;
use std::io::{BufRead, BufReader};

fn return_lines(need_filter:bool) -> Box<dyn Iterator<Item = String>> {
    let f = File::open("sample.txt").unwrap();
    let buf = BufReader::new(f);
    if need_filter {
        let result= buf.lines()
            .filter_map(|l| l.ok())
            .map(|l| l.replace("A", "B"));
        return Box::new(result)
    }
    let result= buf.lines()
        .map(|l| l.expect("Could not parse line"));
    Box::new(result)
}

fn main() {
    let lines = return_lines(true);
    for line in lines {
        println!("{}", line)
    }
}
成效(取自 Pull Request 的實際範例) 
下列範例使用了上述方法:
在一個 1.7GB 的 JSON 檔案上測試時,記憶體減少了 75%。
處理短字串時使用 compact_str crate
在處理大量小於 24 位元組的短字串時,可使用 compact_str crate 來減少記憶體用量。
Before 
在下面的範例中,該 Vec 保存了一千萬個字串。
fn main() {
    let v: Vec<String> = vec![String::from("ABCDEFGHIJKLMNOPQRSTUV"); 10000000];
    // do some kind of processing
}
After 
最好將它們替換為 CompactString:
use compact_str::CompactString;

fn main() {
    let v: Vec<CompactString> = vec![CompactString::from("ABCDEFGHIJKLMNOPQRSTUV"); 10000000];
    // do some kind of processing
}
成效(取自 Pull Request 的實際範例) 
在下列範例中,以 CompactString 處理短字串:
這帶來了約 20% 的記憶體用量減少。
刪除長壽命結構中不必要的欄位
在程序啟動期間持續保留在記憶體中的結構,可能會影響整體的記憶體用量。在 Hayabusa 中,下列結構(截至 2.2.2 版)特別是被大量保留。
移除與上述結構相關聯的欄位,對於減少整體記憶體用量有些許效果。
Before 
舉例來說,DetectInfo 的欄位在 1.8.1 版之前是如下所示:
#[derive(Debug, Clone)]
pub struct DetectInfo {
    pub rulepath: CompactString,
    pub ruletitle: CompactString,
    pub level: CompactString,
    pub computername: CompactString,
    pub eventid: CompactString,
    pub detail: CompactString,
    pub record_information: CompactString,
    pub ext_field: Vec<(CompactString, Profile)>,
    pub is_condition: bool,
}
After 
如下所示,藉由刪除 record_information 欄位
#[derive(Debug, Clone)]
pub struct DetectInfo {
    pub rulepath: CompactString,
    pub ruletitle: CompactString,
    pub level: CompactString,
    pub computername: CompactString,
    pub eventid: CompactString,
    pub detail: CompactString,
    // remove record_information field
    pub ext_field: Vec<(CompactString, Profile)>,
    pub is_condition: bool,
}
成效(取自 Pull Request 的實際範例) 
在下列範例中,針對偵測結果記錄數量約為 150 萬筆的資料進行測試,
- Reduced memory usage of DetectInfo/EvtxRecordInfo #837
- Reduce memory usage by removing unnecessary regex #894
我們得以達成約 300MB 的記憶體用量減少。
基準測試
使用記憶體配置器的統計功能。
有些記憶體配置器會維護自己的記憶體用量統計。舉例來說,在 mimalloc 中,可呼叫 mi_stats_print_out() 函式來取得記憶體用量。
如何取得統計 
先決條件:您需要如變更記憶體配置器一節所述使用 mimalloc。
- 在
Cargo.toml的 dependencies 區段中,加入 libmimalloc-sys crate: - 每當您想要印出記憶體用量統計時,請寫入下列程式碼,並在
unsafe區塊內呼叫 mi_stats_print_out()。記憶體用量統計將輸出至標準輸出。 -
左上角的
peak/reserved值即為最大記憶體用量。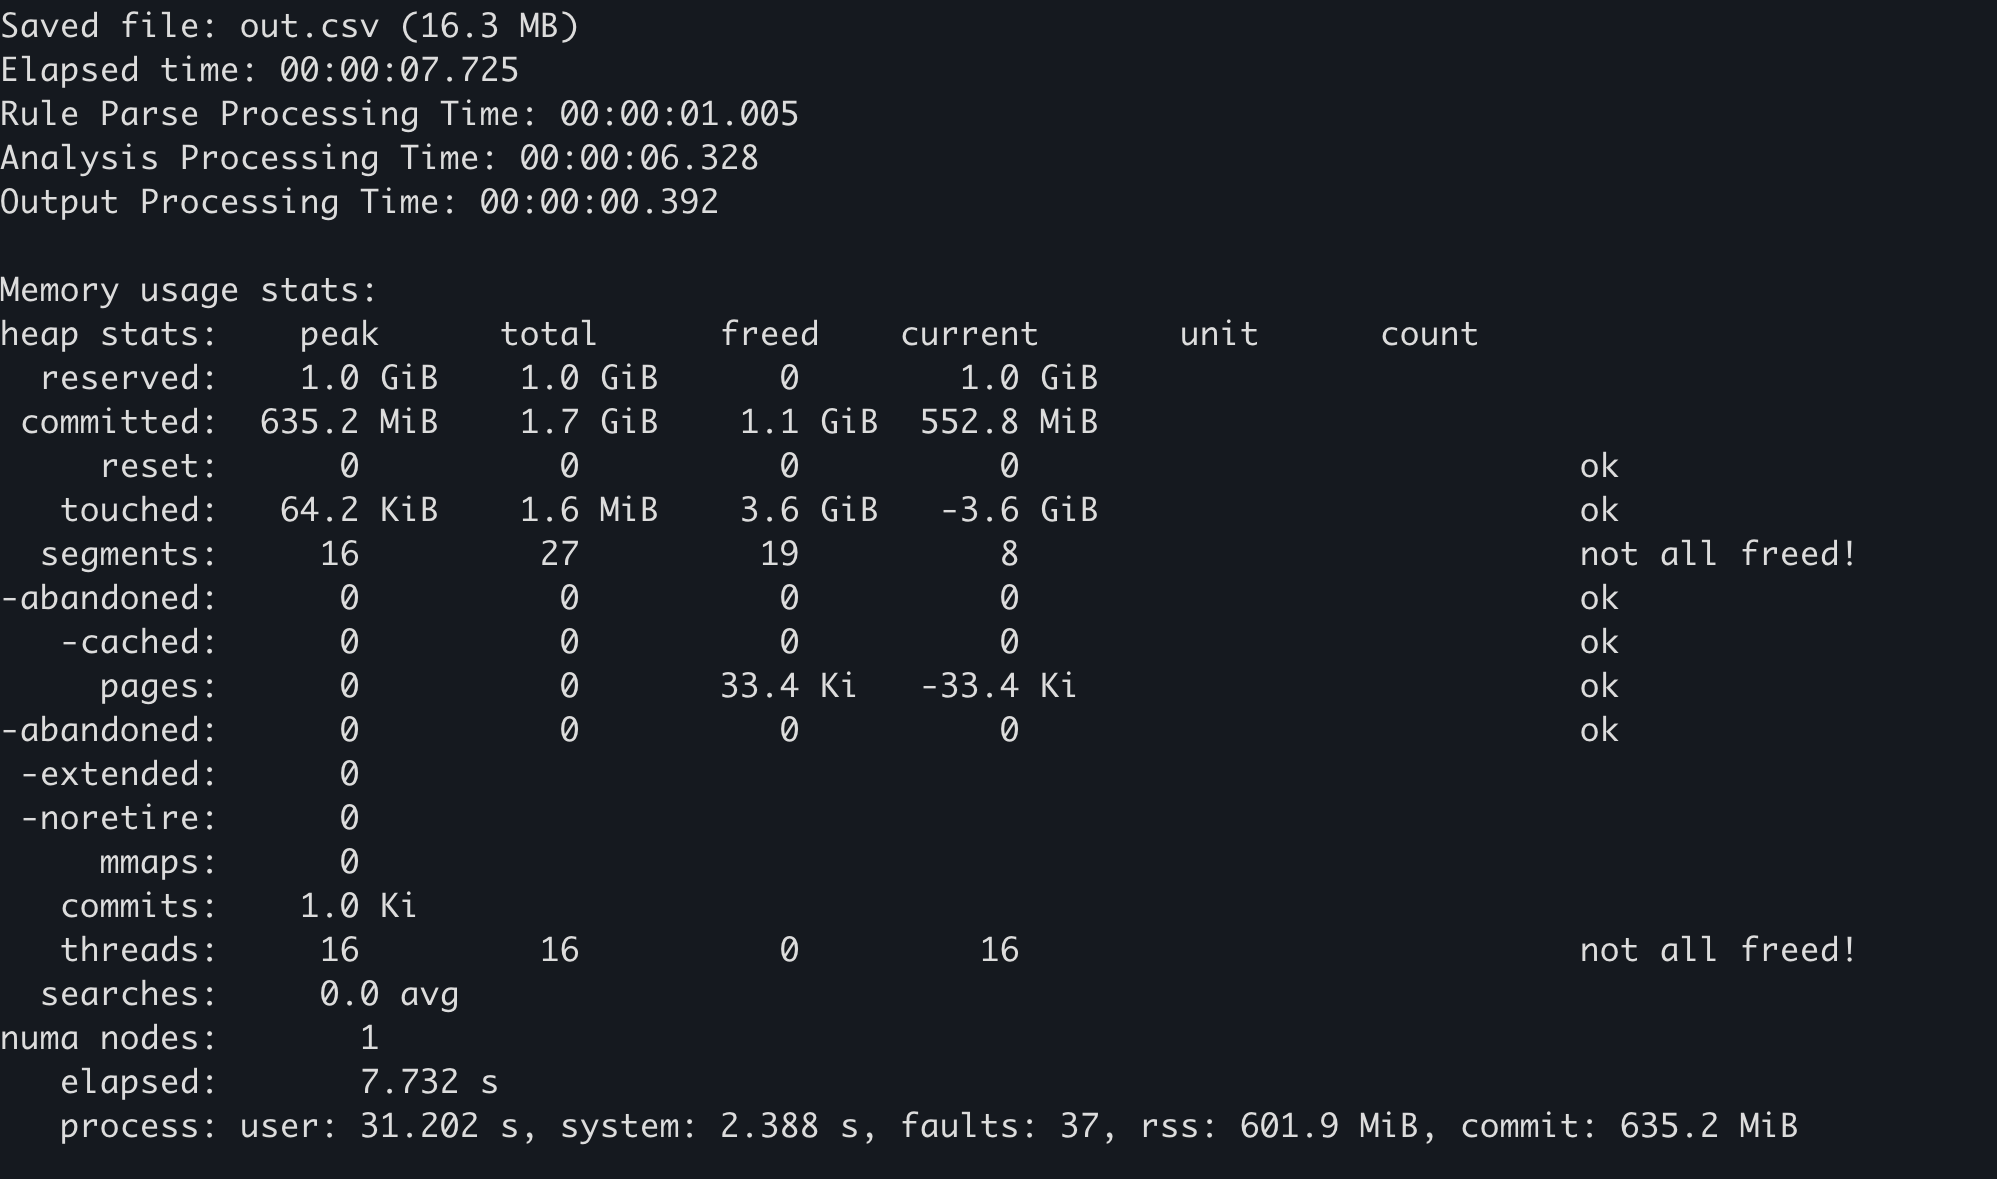
範例 
上述實作已套用於下列:
在 Hayabusa 中,如果您加入 --debug 選項,記憶體用量統計將在結束時輸出。
使用 Windows 的效能計數器
各種資源用量可從 OS 端所取得的統計來檢查。在此情況下,應注意下列兩點。
- 防毒軟體(Windows Defender)的影響
- 只有第一次執行會受到掃描影響而較慢,因此建置後第二次及之後的執行結果適合用來比較。(或者您可以停用防毒軟體以獲得更準確的結果。)
- 檔案快取的影響
- OS 啟動後第二次及之後的結果會比第一次快,因為 evtx 與其他檔案 IO 是從記憶體中的檔案快取讀取,因此 OS 開機後第一次的結果更適合用來進行基準測試。
如何取得 
先決條件:下列步驟僅在 Windows 上已安裝 PowerShell 7 的環境中有效。
- 重新啟動 OS
- 執行
PowerShell 7的 Get-Counter 命令,它會每秒持續將效能計數器記錄到 CSV 檔案。(如果您想要測量下列以外的資源,這篇文章是很好的參考。) - 執行您想要測量的程序。
範例 
下列包含以 Hayabusa 測量效能的範例步驟。
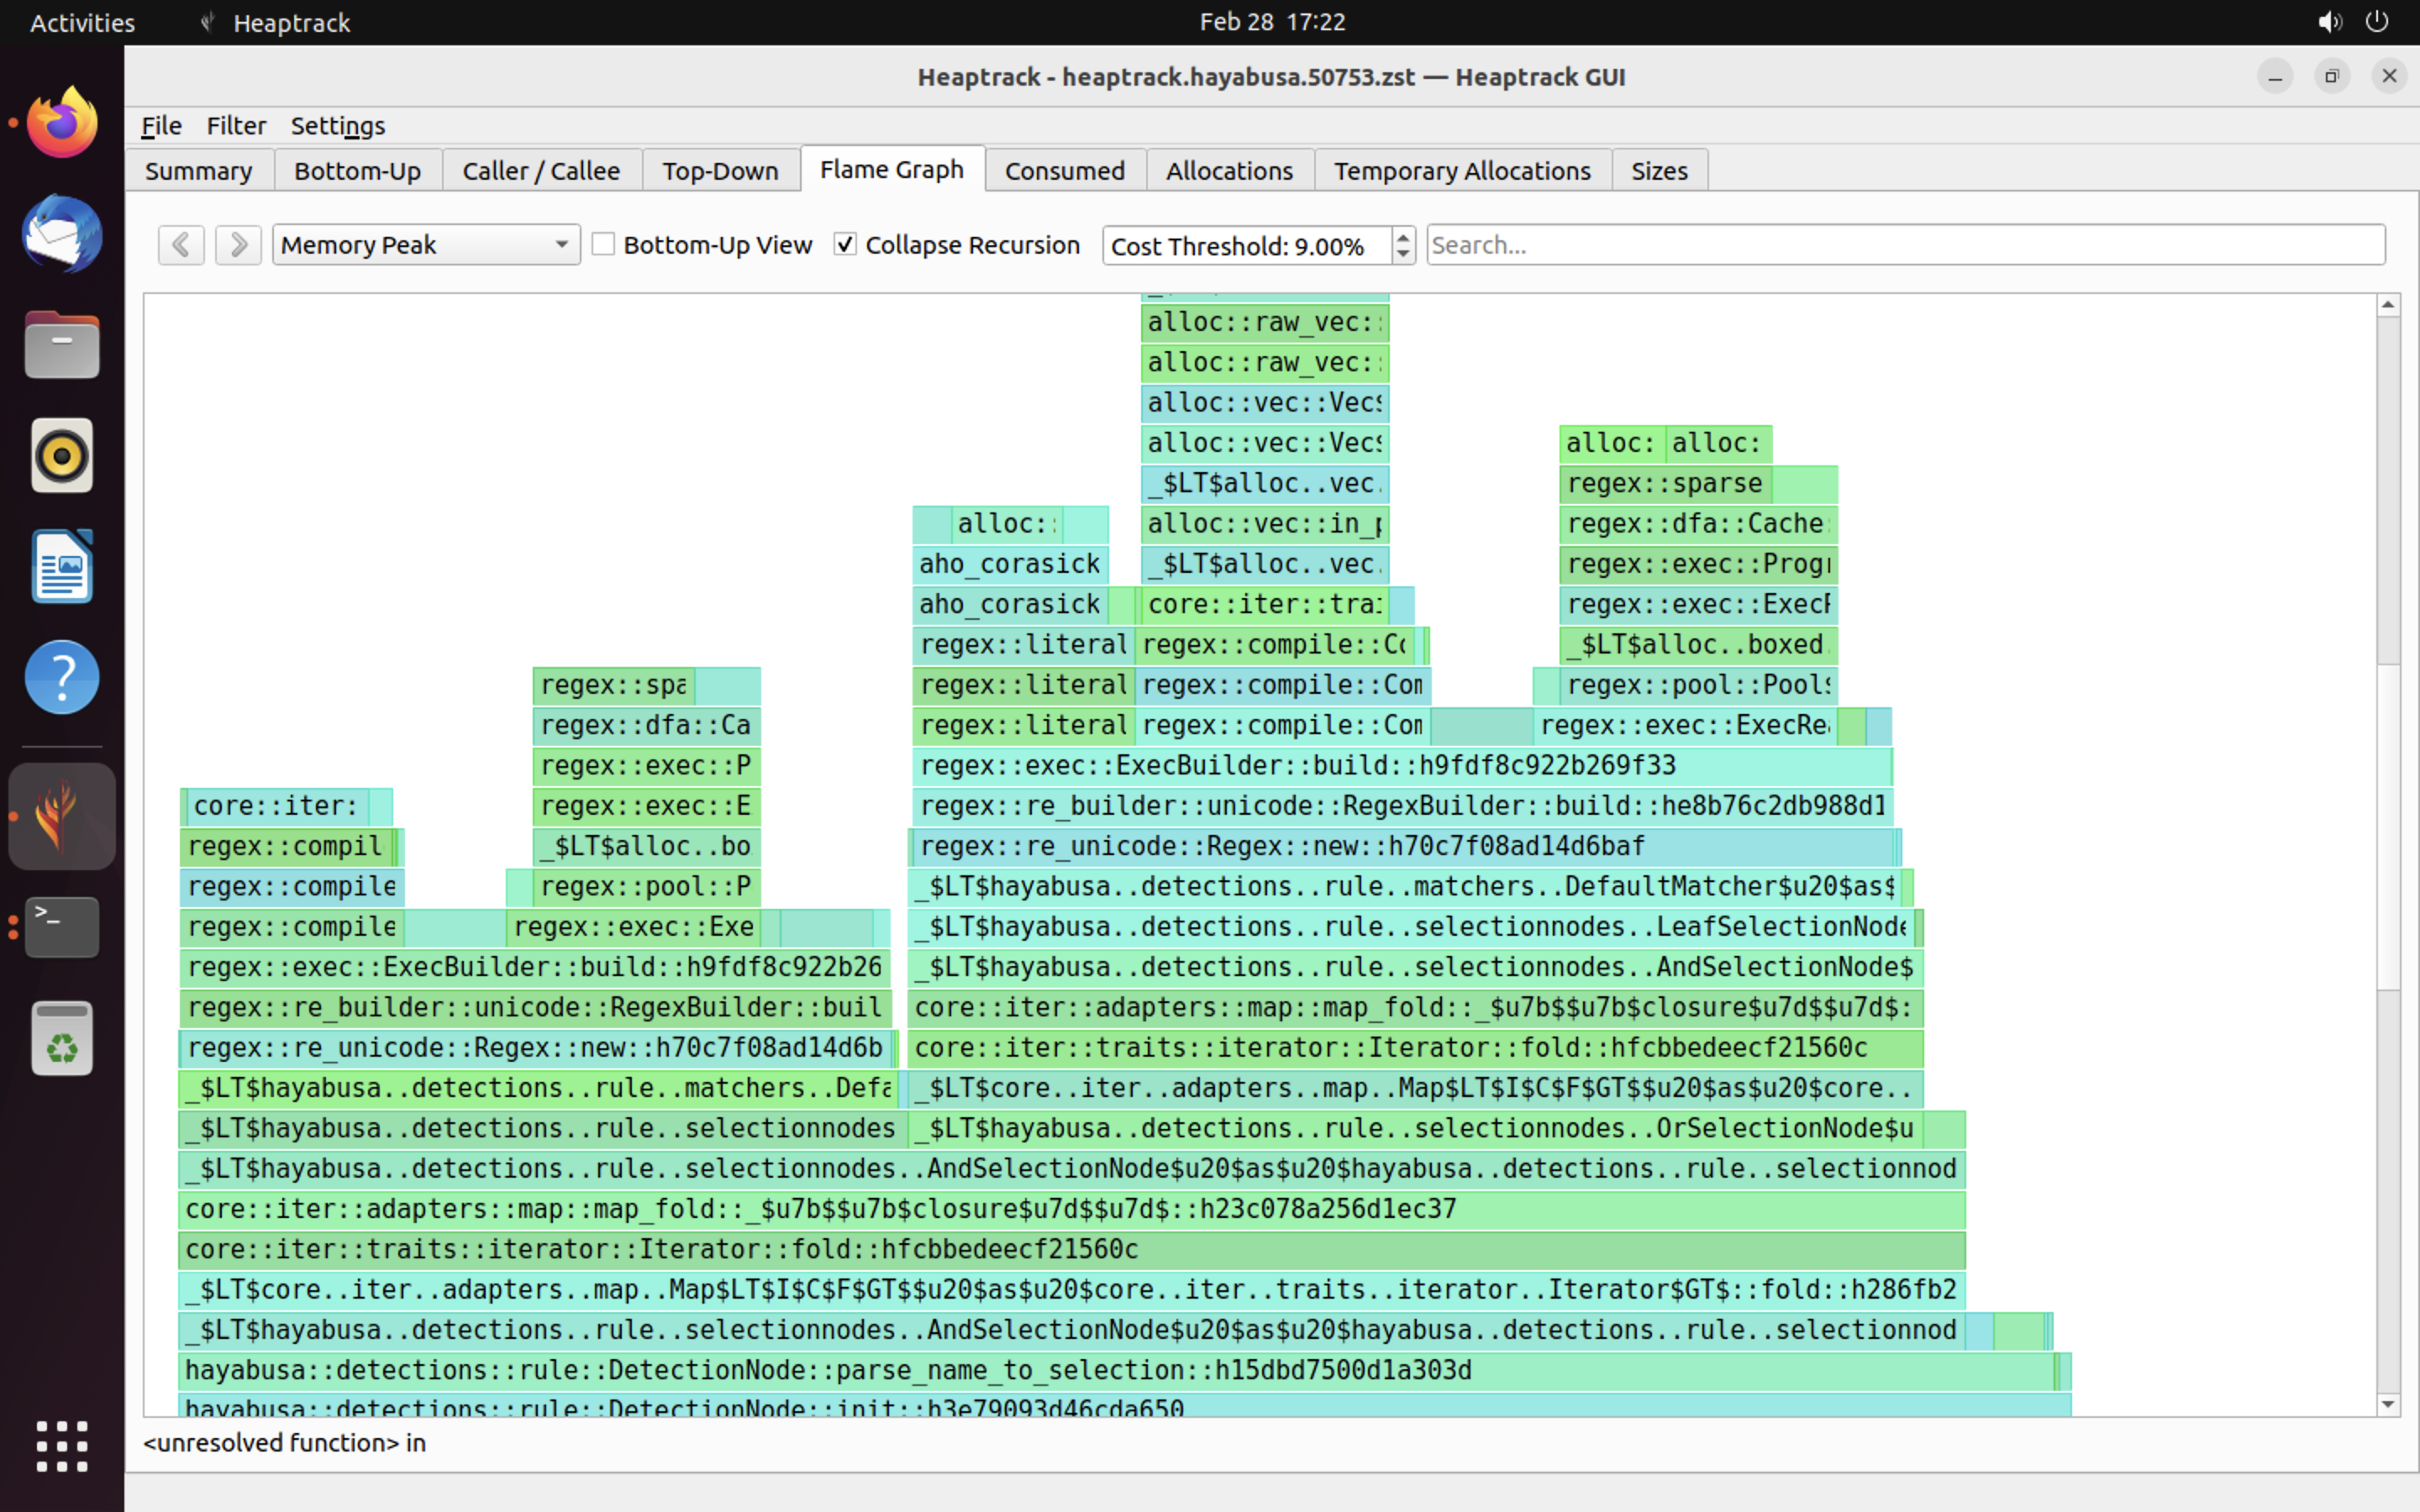
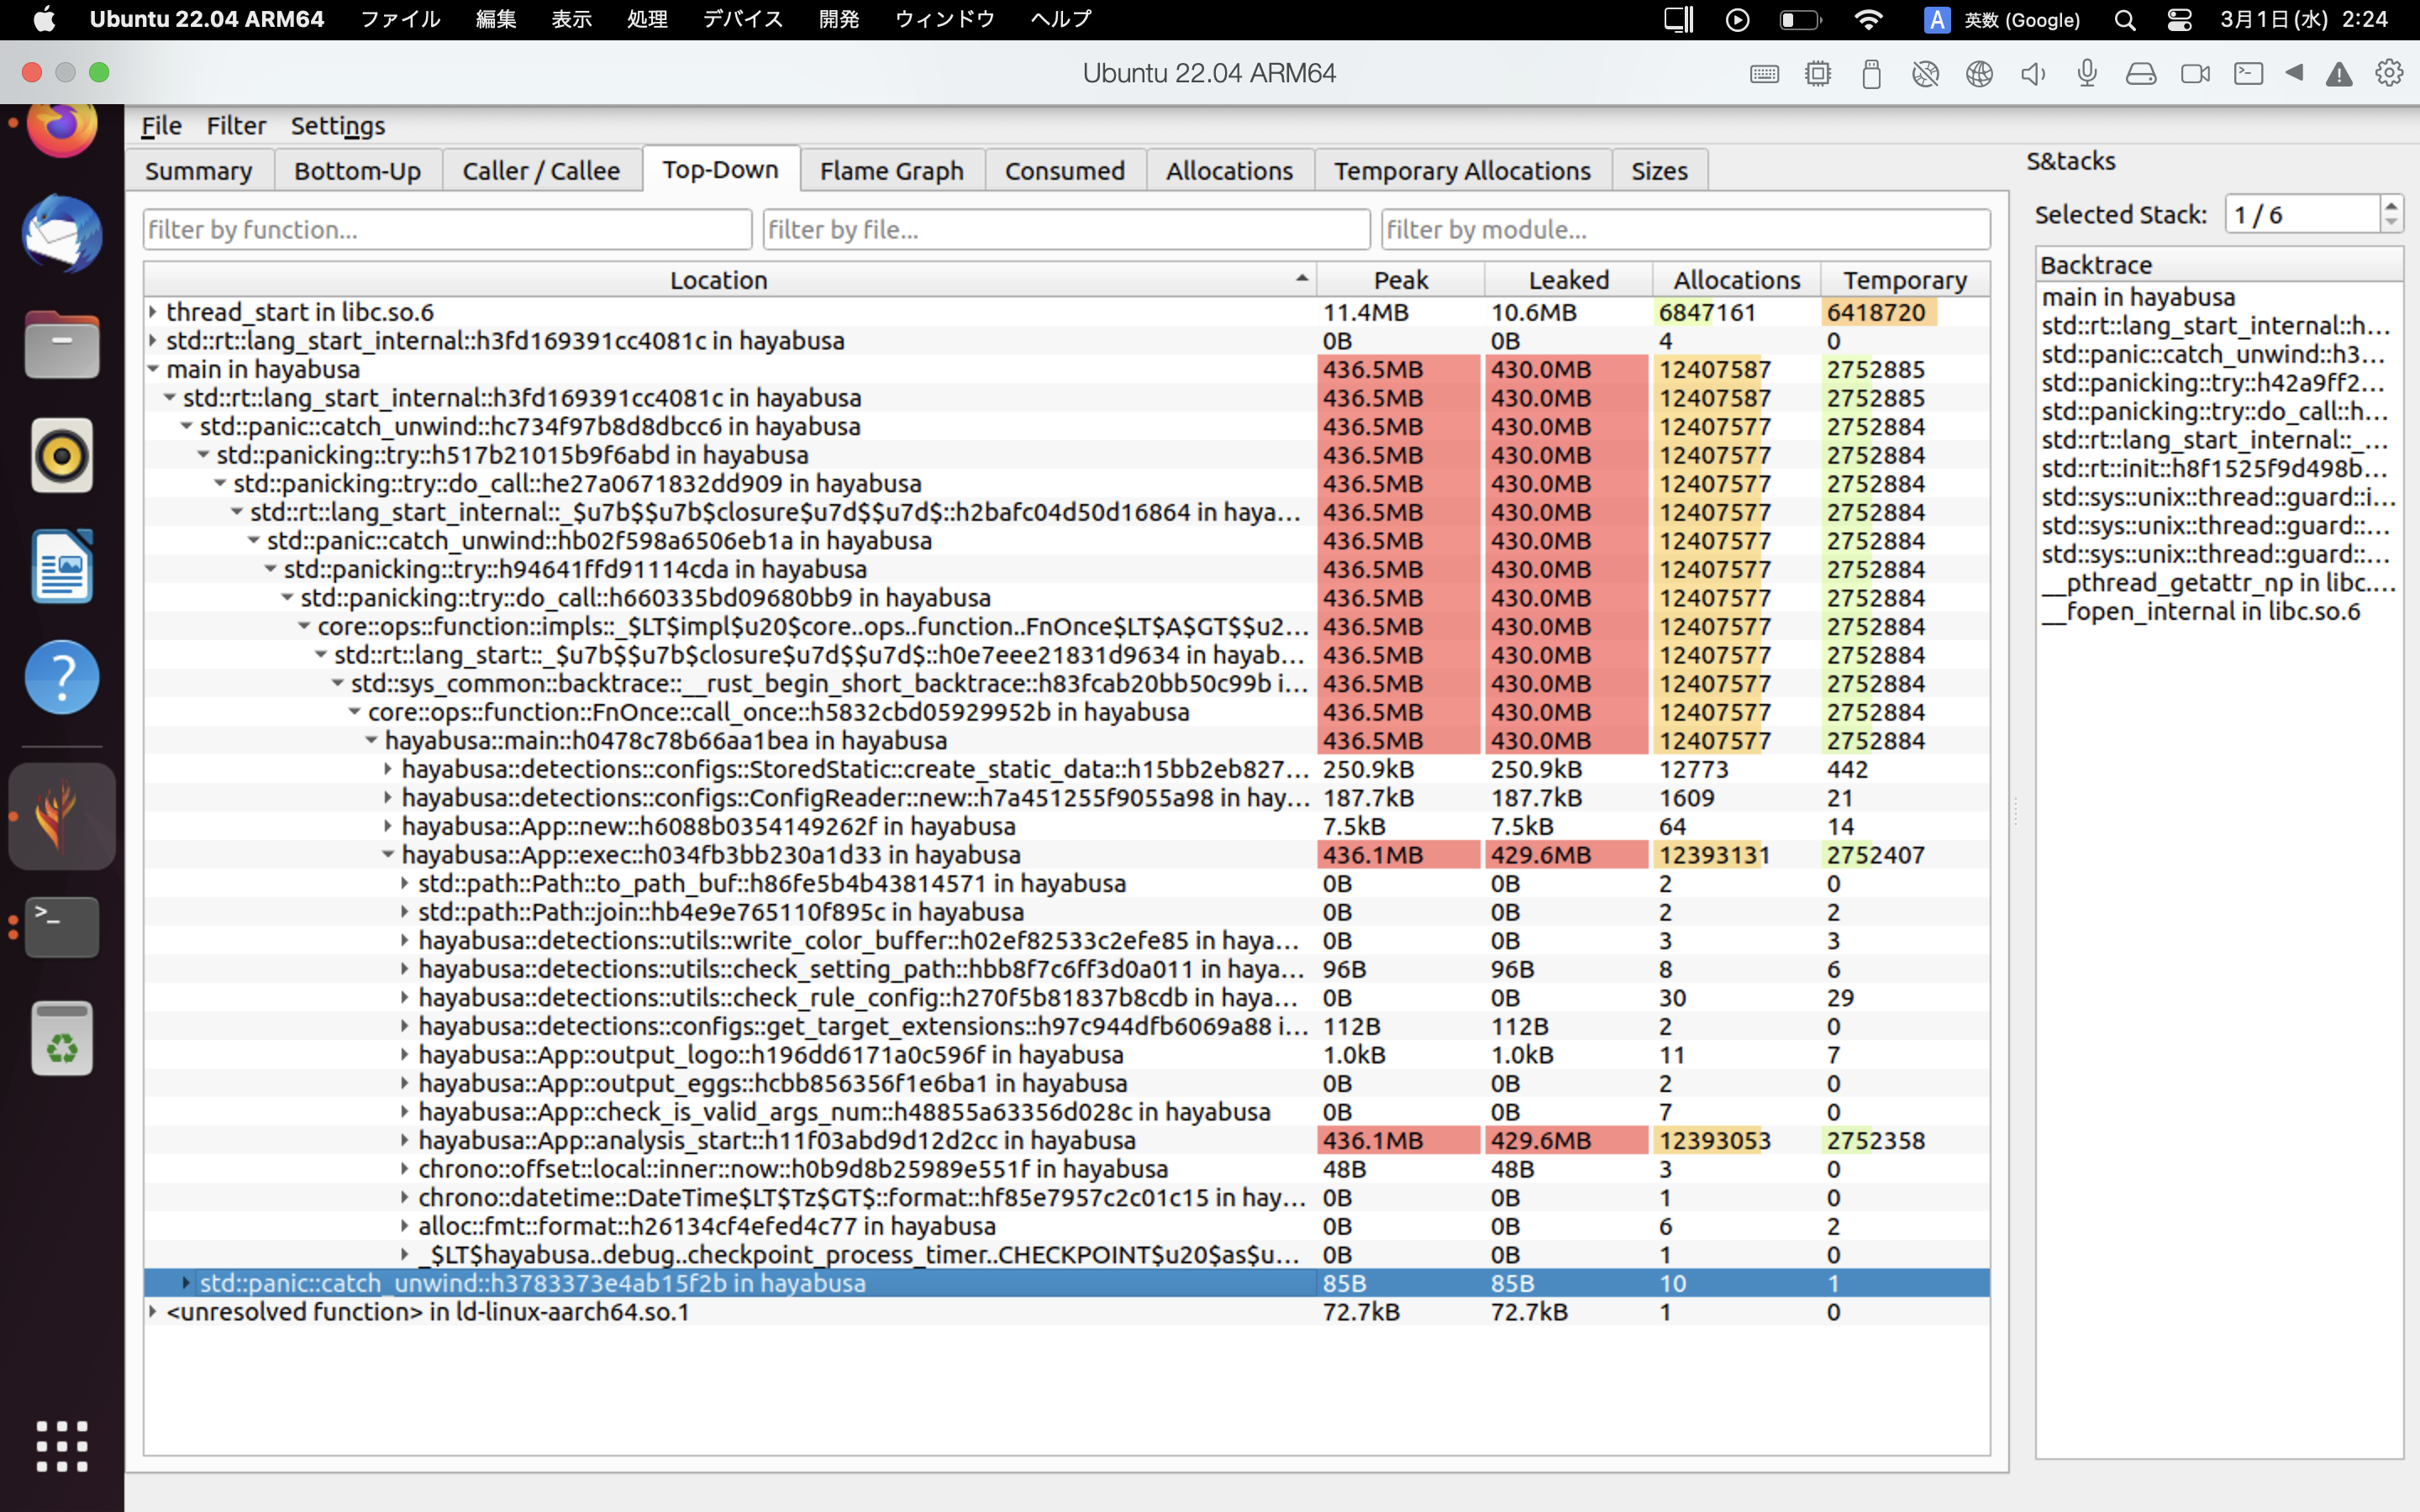
使用 heaptrack
heaptrack 是一款適用於 Linux 與 macOS 的精密記憶體分析器。藉由使用 heaptrack,您可以徹底調查瓶頸所在。
如何取得 
先決條件:以下是 Ubuntu 22.04 的步驟。您無法在 Windows 上使用 heaptrack。
- 以下列兩個命令安裝 heaptrack。
- 從 Hayabusa 移除下列 mimalloc 程式碼。(您無法以 mimalloc 使用 heaptrack 的記憶體分析器。
- https://github.com/Yamato-Security/hayabusa/blob/v2.2.2/src/main.rs#L32-L33
- https://github.com/Yamato-Security/hayabusa/blob/v2.2.2/src/main.rs#L59-L60
-
https://github.com/Yamato-Security/hayabusa/blob/v2.2.2/src/main.rs#L632-L634
-
刪除 Hayabusa
Cargo.toml檔案中的 [profile.release] 區段,並將其改為下列內容: -
建置 release 版本:
cargo build --release - 執行
heaptrack hayabusa csv-timeline -d sample -o out.csv
現在當 Hayabusa 執行結束時,heaptrack 的結果將自動在 GUI 應用程式中開啟。
範例 
heaptrack 結果的範例如下所示。Flame Graph 與 Top-Down 分頁讓您能以視覺方式檢查記憶體用量高的函式。
參考資料
貢獻
本文件是根據 Hayabusa 中實際改善案例的發現所撰寫。如果您發現任何錯誤或可改善效能的技巧,請向我們送出 issue 或 pull request。